
Flow cytometry is a powerful technique used in the field of cell biology to analyze and quantify various properties of cells. It provides invaluable insights into cellular characteristics such as size, complexity, and marker expression. Understanding how to properly analyze flow cytometry data is crucial for researchers to obtain meaningful results and draw accurate conclusions from their experiments.
Whether you are studying immune cells, cancer cells, or any other type of cells, analyzing flow cytometry data can be a complex task. It involves navigating through large datasets and employing specialized software to identify cell populations, gate cells of interest, and extract important information. This article will guide you through the process of analyzing flow cytometry data, covering key steps, common pitfalls, and best practices.
Inside This Article
- Flow Cytometry Basics
- Pre-processing Steps for Flow Cytometry Data Analysis
- Gating Strategies for Flow Cytometry Data Analysis
- Common Techniques for Flow Cytometry Data Analysis
- Conclusion
- FAQs
Flow Cytometry Basics
Flow cytometry is a powerful technique used in cell biology and immunology to analyze and characterize cells based on their physical and chemical properties. It allows researchers to study individual cells within a heterogeneous population and provides valuable insights into cell size, morphology, viability, and protein expression.
At its core, flow cytometry involves the measurement of light scattering and emission of fluorochromes by cells as they flow through a laser-based detection system. This technique provides quantitative data about various cellular parameters, enabling researchers to differentiate and subclassify different cell types.
The primary instrument used in flow cytometry is the flow cytometer, which consists of three main components: a fluidics system, an optical system, and an electronics system. The fluidics system controls the flow of cells through a narrow capillary tube, ensuring each cell passes through the laser beam for analysis. The optical system includes lasers, filters, and detectors that measure the light scattering and fluorescence emission from the cells. The electronics system converts the detected signals into digital data for further analysis.
Flow cytometry data analysis involves several essential steps, including data pre-processing, gating strategies, and the application of specific analysis techniques.
During pre-processing, raw flow cytometry data is transformed into a more manageable format suitable for analysis. This typically involves removing unwanted noise, compensating for spectral overlap between fluorochromes, and normalizing the data to account for variations in instrument settings and acquisition conditions.
Gating strategies are then applied to identify and isolate specific cell populations of interest within the data. Gating involves creating regions or gates based on scatter and fluorescence parameters to distinguish different cell populations. This allows researchers to focus their analysis on the cells they are interested in, excluding unwanted background noise or debris.
Once the data has been pre-processed and gated, researchers can apply various analysis techniques to extract meaningful information. This includes assessing cell viability, determining cell cycle distribution, measuring protein expression levels, and analyzing subpopulation distribution.
Flow cytometry is a versatile and widely used technique with applications in various fields, including immunology, oncology, hematology, and drug discovery. It provides a robust and quantitative analysis of cellular characteristics, allowing researchers to gain a deeper understanding of complex biological processes.
Overall, understanding the basics of flow cytometry is essential for researchers and scientists looking to effectively analyze and interpret flow cytometry data. By employing appropriate pre-processing techniques, gating strategies, and analysis approaches, researchers can derive valuable insights from their flow cytometry experiments.
Pre-processing Steps for Flow Cytometry Data Analysis
Flow cytometry is a powerful technique used to analyze and quantify cellular characteristics. However, before diving into the analysis, it is important to perform several pre-processing steps to ensure accurate and reliable results. These steps involve data transformation, quality control, and normalization. Let’s explore each of these steps in detail.
Data Transformation: The first step in the pre-processing of flow cytometry data is to transform the raw data into a format suitable for analysis. This often involves logarithmic transformation of fluorescence intensity values to ensure a more linear relationship between the measured signals and the underlying biological quantities.
Quality Control: Once the data is transformed, it is crucial to perform quality control checks to identify and remove any anomalies or artifacts in the data. This can include removing outliers, identifying and excluding improperly stained cells or debris, and flagging any potential issues that may affect the reliability of the analysis.
Normalization: Normalization is an important step to account for technical variations in flow cytometry data. It allows for meaningful comparisons between samples by accounting for differences in instrument settings, sample staining conditions, and other factors that can introduce variability. Common normalization techniques include scaling the data based on a reference sample or using internal control populations.
Compensation: Another crucial pre-processing step in flow cytometry analysis is compensation. Compensation corrects for spectral overlap that occurs when fluorescent markers emit signals in multiple detection channels. This step involves creating compensation matrices to remove the fluorescence spillover from one channel to another, ensuring accurate measurement of each fluorochrome.
Data Filtering: To further refine the dataset, data filtering techniques can be applied. This involves setting thresholds to exclude events that fall below or exceed certain criteria. For example, gating can be applied to exclude doublets, dead cells, or non-specific background signals, allowing for analysis of the desired cell population.
Data Normalization: In addition to normalization, it is essential to normalize the data by accounting for differences in sample size or cell number. This enables meaningful comparison between samples and helps account for variations in cellular abundance.
Data Analysis: After the pre-processing steps are completed, the flow cytometry data is ready for analysis. This can involve identifying and characterizing distinct cell populations, determining expression levels of specific markers, or investigating changes in cellular behavior under different experimental conditions.
By following these pre-processing steps, flow cytometry data can be effectively prepared and analyzed, leading to accurate and reliable results. Each step plays a vital role in optimizing data quality and ensuring that the subsequent analysis accurately reflects the underlying biological phenomena.
Gating Strategies for Flow Cytometry Data Analysis
Gating is a crucial step in flow cytometry data analysis that involves defining the population of interest and excluding unwanted events. It is important to establish appropriate gating strategies to accurately interpret the data and retrieve meaningful results. Here, we will discuss some commonly used gating strategies in flow cytometry data analysis.
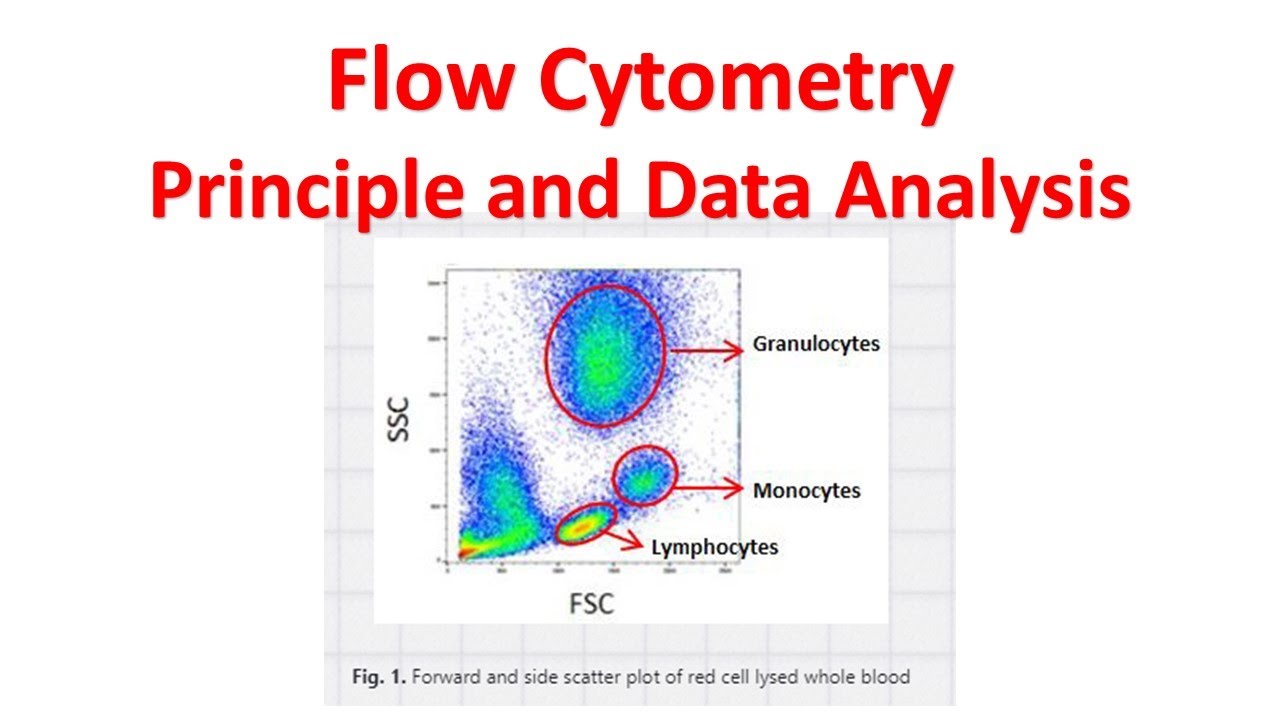
1. Forward Scatter (FSC) vs. Side Scatter (SSC) Gating:
One of the initial gating strategies involves setting a gate based on the scatter properties of the cells. The forward scatter (FSC) parameter measures the cell size, while the side scatter (SSC) parameter gives an indication of cellular complexity or granularity. By gating on specific regions in the FSC vs. SSC plot, different cell populations can be identified based on their size and complexity.
2. Single Parameter Histogram Gating:
In this strategy, individual parameters or markers are analyzed separately to identify distinct cell populations. By plotting each parameter as a histogram, gates can be placed to separate positive and negative populations. This gating strategy is particularly useful when analyzing a single marker or when dealing with highly expressed markers that have well-defined positive and negative populations.
3. Multiparameter Gating:
Flow cytometry allows the simultaneous analysis of multiple parameters such as fluorescence intensity. Multiparameter gating involves creating bi-dimensional plots combining two or more parameters to identify cell populations of interest. These plots can reveal complex relationships between markers and aid in identifying subpopulations within a sample.
4. Boolean Gate Combinations:
Boolean gate combinations involve merging multiple single parameter gates or regions of interest to define specific cell populations. This can be achieved by applying logical operators such as AND, OR, and NOT. Boolean gate combinations are useful when analyzing complex datasets with multiple markers or when studying rare cell populations.
5. Time Gating:
Time gating focuses on excluding debris or non-viable cells from the analysis. By gating on the time parameter, events that occur earlier in the acquisition can be excluded, as they are likely to represent noise, debris, or non-specific binding. This gating strategy helps improve data quality and ensures that only relevant events are considered in the analysis.
By implementing these gating strategies, flow cytometry data analysts can effectively identify and analyze specific cell populations within complex datasets. It is crucial to choose the appropriate gating strategy based on the experimental design and research question to ensure accurate and meaningful interpretation of flow cytometry data.
Common Techniques for Flow Cytometry Data Analysis
Flow cytometry is a powerful technique used to study various cellular parameters and analyze specific cell populations. Once the data has been acquired, it is essential to apply appropriate techniques to analyze and interpret the vast amount of information generated. Here are some common techniques for flow cytometry data analysis:
1. Data visualization: Visualization is a crucial step in flow cytometry data analysis as it allows researchers to identify patterns, outliers, and trends within the data. Scatter plots, histograms, density plots, and heatmaps are commonly used to visualize single-cell measurements and compare multiple samples.
2. Data gating: Gating is the process of defining subpopulations within a sample based on specific parameters. It involves setting regions or gates on scatter or fluorescence plots to distinguish cells of interest from debris and unwanted cells. Gating can be done manually or automatically using software tools.
3. Data compensation: Compensation is necessary to correct for spectral overlap between fluorochromes used in multicolor flow cytometry experiments. It ensures that each fluorochrome’s signal is accurately measured by subtracting the contribution from other fluorochromes in the experiment. Various compensation algorithms and tools are available to simplify this process.
4. Data normalization: Normalization is important for comparing flow cytometry data across multiple samples or experiments. It involves scaling the data to a common reference point, such as the median fluorescence intensity of a specific control sample. Normalization allows for more accurate comparisons between samples and reduces variability caused by instrument settings or staining variability.
5. Statistical analysis: Statistical analysis plays a crucial role in flow cytometry data interpretation. It involves applying appropriate statistical tests to determine if observed differences between samples are statistically significant. Common statistical tests include t-tests, ANOVA, and non-parametric tests, depending on the experimental design and distribution of the data.
6. Multivariate analysis: Multivariate analysis techniques are used when there are multiple parameters or variables in flow cytometry data. Principal component analysis (PCA), t-distributed stochastic neighbor embedding (t-SNE), and hierarchical clustering are commonly used to identify cell populations with similar phenotypes or to visualize high-dimensional data in a reduced dimensional space.
7. Data integration: Flow cytometry data is often combined with other omics data, such as transcriptomics or proteomics, to gain a more comprehensive understanding of cellular function. Integrative analysis techniques, such as correlation analysis, pathway analysis, and network analysis, can provide insights into the relationship between different cellular components and their biological relevance.
8. Quality control: Quality control is essential to ensure the reliability and reproducibility of flow cytometry data. It involves assessing instrument performance, validating staining protocols, checking for technical artifacts, and monitoring the consistency of control samples. Quality control measures help identify and minimize potential sources of variability or bias in the data.
By applying these common techniques for flow cytometry data analysis, researchers can gain valuable insights into cellular processes, identify specific cell populations, and make meaningful comparisons between samples. The choice of technique depends on the research question, experimental design, and the complexity of the data.
Conclusion
With the increasing popularity of flow cytometry in various fields of research, it is crucial to have a solid understanding of how to analyze the data generated from this powerful technique. By following the steps outlined in this article, you can ensure accurate and reliable interpretation of your flow cytometry results.
Remember to start by preprocessing your data and performing quality control checks to identify and exclude any anomalies or artifacts. Then, carefully select appropriate gating strategies to isolate the cell populations of interest. Utilize statistical analyses and visualization tools to gain meaningful insights from your data.
By implementing these best practices and optimizing your flow cytometry data analysis workflow, you can effectively uncover valuable information about cellular characteristics, protein expression levels, and cell populations. This will ultimately contribute to the advancement of scientific knowledge and drive discoveries in numerous fields ranging from immunology to cancer research.
So, roll up your sleeves and dive into the world of flow cytometry data analysis. Unlock the mysteries hiding within your data and unleash the potential for groundbreaking discoveries!
FAQs
1. What is flow cytometry?
Flow cytometry is a powerful technique used in cell biology and immunology to analyze and quantify various properties of individual cells within a heterogeneous population. It involves the use of laser-based technology to measure characteristics such as cell size, shape, and protein expression.
2. How does flow cytometry work?
In flow cytometry, cells are labeled with fluorescent probes that bind to specific molecules of interest, such as antibodies targeting cell surface markers or intracellular proteins. The labeled cells are then suspended in a fluid stream and passed through a flow cell. As cells flow through the laser beam, the fluorescent probes are excited and emit light at specific wavelengths. The emitted light is collected by detectors and converted into electronic signals, providing information about the cells’ characteristics.
3. What can flow cytometry be used for?
Flow cytometry has a wide range of applications in research, medicine, and diagnostics. It can be used to analyze immune cell populations, identify and sort cell subpopulations, study cell cycle progression, measure cell viability and proliferation, assess apoptosis, and determine intracellular signaling events. It is also commonly used in clinical laboratories for immunophenotyping, AIDS monitoring, and cancer diagnostics.
4. What are the advantages of flow cytometry?
Flow cytometry offers several advantages over traditional methods of cell analysis. It provides rapid and high-throughput analysis of large cell populations, allowing researchers to analyze thousands of cells per second. It also allows the simultaneous measurement of multiple parameters, making it a versatile tool for studying complex biological systems. In addition, flow cytometry enables the isolation of specific cell populations based on their characteristics, facilitating further downstream analysis.
5. What are some challenges in flow cytometry data analysis?
Flow cytometry data analysis can be complex and requires proper gating, compensation, and standardization protocols. Gating involves setting criteria to identify and exclude unwanted events or debris from the analysis. Compensation is necessary to correct for spectral overlap between fluorochromes used in multiple staining panels. Standardization ensures that data generated from different instruments or laboratories can be compared and combined reliably.