
Are you struggling to find the phase shift from your data? Look no further! In this comprehensive guide, we will walk you through the step-by-step process of finding the phase shift using your data. Whether you are a student studying waveforms or a researcher analyzing experimental results, understanding how to determine the phase shift is crucial. By accurately determining the phase shift, you can gain valuable insights into the relationship between different variables, identify patterns, and make informed decisions. With our expert tips and techniques, you will be able to confidently analyze your data and extract meaningful information. So, let’s dive in and unlock the secrets of finding the phase shift from your data!
Inside This Article
- Subtitle 2: Understanding Phase Shift
- Subtitle 3: Methods for Finding Phase Shift
- Subtitle 4: Example Analysis of Data
- Conclusion
- FAQs
Subtitle 2: Understanding Phase Shift
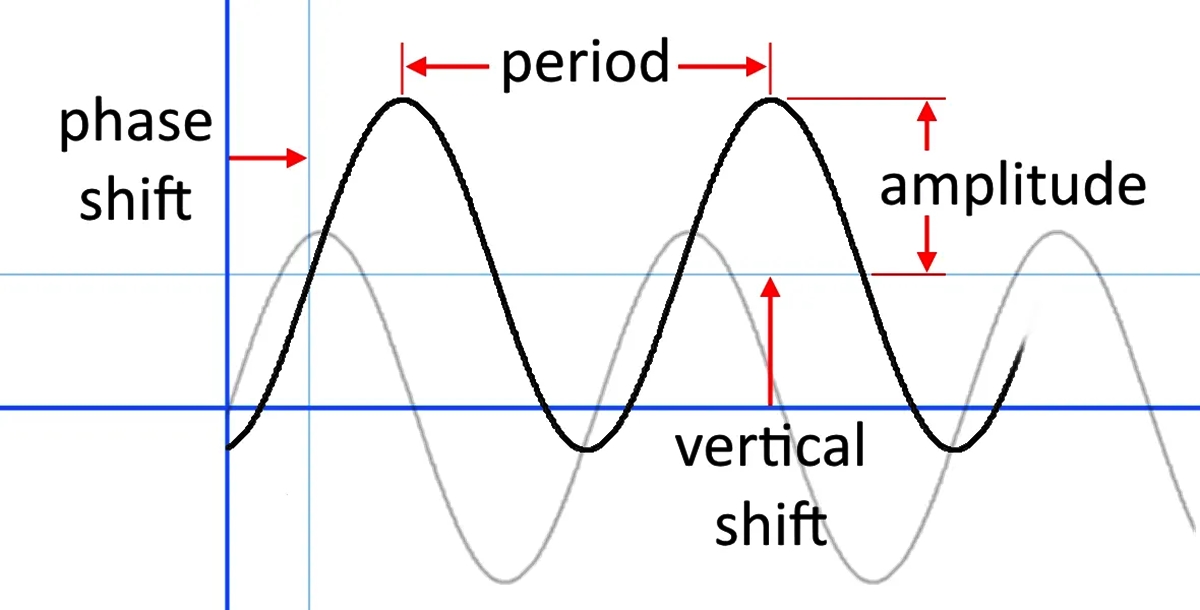
Phase shift is an important concept in signal processing and waveform analysis. It refers to the displacement or shift in the phase of a waveform, typically measured in degrees or radians. Understanding phase shift is crucial for various fields, including electrical engineering, physics, and telecommunication.
At its core, phase shift represents the delay or advancement in the timing of a waveform relative to a reference point. It is often visualized as a shift in the waveform’s position along the horizontal axis. The reference point is usually the starting point of the waveform or a specific feature within the waveform.
Phase shift can be caused by various factors, such as changes in frequency, changes in the medium through which the signal propagates, or the presence of filters or amplifiers in the signal path. It is a fundamental characteristic of signals and plays a crucial role in many applications.
For example, in audio processing, phase shift can affect the quality of stereo sound reproduction. If the left and right channels of a stereo signal experience different phase shifts, it can result in a phenomenon known as “phase cancellation,” which leads to a loss of clarity and imaging in the sound.
In telecommunications, phase shift is used for modulation techniques such as quadrature amplitude modulation (QAM) and phase-shift keying (PSK). These techniques involve manipulating the phase of the carrier signal to encode information, allowing for efficient data transmission over communication channels.
Understanding phase shift is essential for analyzing waveforms and interpreting signals accurately. It enables us to measure the time delay between different parts of a waveform, determine the frequency response of systems, and design filters to compensate for phase distortions.
Overall, phase shift is a fundamental concept in signal processing that underlies many aspects of modern technology. By understanding how phase shift affects waveforms, we can improve our ability to analyze and manipulate signals, leading to advancements in various fields and applications.
Subtitle 3: Methods for Finding Phase Shift
When analyzing data to find the phase shift, there are several methods that can be used. These methods take into account the characteristics of the data and the specific requirements of the analysis. Here are some commonly used techniques:
1. Cross-Correlation: Cross-correlation is a technique used to find the time delay between two signals. In the context of finding phase shift, it can be used to determine the lag between two waveforms. By comparing the similarity between the two waveforms at different time lags, the phase shift can be estimated. Cross-correlation is particularly useful when dealing with noisy or distorted data.
2. Fourier Analysis: Fourier analysis is a mathematical method used to analyze periodic waveforms. By decomposing a waveform into its constituent frequencies, Fourier analysis can provide information about the phase shift. By examining the relative phase angles of the waveform components, the phase shift can be determined. This method is commonly used in signal processing and communication systems.
3. Least Squares Fitting: Least squares fitting is a technique used to find the best-fit parameters for a given mathematical model. In the context of phase shift analysis, a mathematical model is fitted to the data using a least squares approach. The phase shift can then be extracted from the fitted model. This method is particularly helpful when dealing with complex waveforms that cannot be easily analyzed using other methods.
4. Waveform Alignment: Waveform alignment is a technique used to align two waveforms in order to find the phase shift. By adjusting the time delay between the two waveforms, the alignment process maximizes the similarity between them. Once the waveforms are aligned, the phase shift can be calculated based on the time delay. This method is commonly used when comparing two similar signals.
5. Time-Frequency Analysis: Time-frequency analysis is a technique used to analyze the frequency content of a time-varying signal. By examining the variation of frequency components over time, time-frequency analysis can provide insights into the phase shift. This method is particularly useful when analyzing signals with varying phase components. Common time-frequency analysis techniques include the Short-Time Fourier Transform (STFT) and the Wavelet Transform.
It is important to note that the choice of method depends on the specific characteristics of the data and the requirements of the analysis. Depending on the complexity of the waveform and the level of accuracy needed, different methods may yield more accurate results. It is recommended to experiment with different methods and compare the results to validate the accuracy of the phase shift estimation.
Subtitle 4: Example Analysis of Data
Now that we have discussed the concept of phase shift and various methods to calculate it, let’s delve into an example analysis of data to further illustrate the process. Imagine we have a set of voltage and time data points collected from an electrical circuit experiment.
First, we need to ensure that the data is properly organized and labeled. Each data point should correspond to a specific time and voltage measurement. This will facilitate accurate analysis and calculation of phase shift.
Next, we can plot the voltage data as a function of time on a graph. This will give us a visual representation of how the voltage changes over time. By examining the graph, we can identify any oscillations or patterns in the data.
Once we have the plotted data, we can identify the points where the voltage crosses zero. These are called zero-crossings and are crucial for determining the phase shift. We can mark these points on the graph to make them easier to identify.
With the zero-crossings identified, we can calculate the time difference between the corresponding points on the voltage and reference waveforms. This time difference represents the phase shift between the two waveforms.
For example, let’s say the voltage waveform lags behind the reference waveform. This means that the zero-crossing of the voltage waveform occurs later in time compared to the zero-crossing of the reference waveform. By measuring the time difference between the two zero-crossings, we can determine the amount of phase shift.
It’s important to note that the accuracy of our analysis depends on the quality and precision of our data. Therefore, it’s crucial to ensure that the data is gathered using reliable measurement techniques and equipment.
Once we have calculated the phase shift, we can use this information to gain insights into the behavior of the electrical circuit. Phase shift is a fundamental concept in understanding the interaction between different waveforms and can be used to analyze the performance and stability of various systems.
By conducting thorough data analysis and accurately calculating phase shift, we can unlock valuable information about the dynamics of the circuit and make informed decisions for further optimization or troubleshooting.
Conclusion
Understanding phase shift in data is key to gaining deeper insights and making informed decisions. By identifying the phase shift, we can uncover important patterns, relationships, and trends that may not be apparent at first glance. Whether analyzing financial data, electrical signals, or any other dataset, the ability to find the phase shift can provide valuable information.
With a solid understanding of the concept and various methods to calculate phase shift, we can confidently apply this knowledge to different fields and domains. However, it’s important to remember that phase shift calculations are just one piece of the puzzle. They should be used in combination with other analytical techniques and tools to obtain a comprehensive understanding of the data.
By exploring the various methods and techniques mentioned in this article, we can effectively find the phase shift from data and use it to enhance our understanding of the underlying patterns and dynamics. So, the next time you come across a dataset, don’t forget to consider the phase shift and unlock its hidden insights.
FAQs
- What is phase shift?
- Why is phase shift important?
- How can I find the phase shift from data?
- Are there any specific techniques or tools to find phase shift from data?
- Can you give an example of finding phase shift from data?
Phase shift refers to the displacement or delay in the waveform of a periodic signal with respect to another reference waveform. It is measured in degrees or radians and represents the change in timing between two signals.
Phase shift is crucial in various fields, including electronics, telecommunications, and signal processing. It helps determine how signals interact, synchronize, or interfere with each other. Understanding phase shift enables precise control of signal timing and synchronization, ensuring efficient communication and optimal system performance.
To find the phase shift from data, you need to analyze the relationship between two or more signals. One common method is to measure the time difference (in seconds) of the corresponding points on the waveforms. Convert this time difference into degrees or radians using the frequency of the signal, and that will give you the phase shift.
Yes, there are various techniques and tools available to find phase shift from data. One popular method is using an oscilloscope, a device that displays and measures waveforms. Time-domain analysis, cross-correlation, and Fourier analysis are commonly used techniques as well. Additionally, there are software applications and programming libraries that provide advanced tools for phase shift analysis.
Certainly! Let’s say you have two audio signals, A and B, and you want to find the phase shift between them. Start by recording the signals and sampling them at a high enough frequency. Then, plot the waveforms of both signals on a graph. Identify corresponding points on the waveforms, such as the peaks or zero-crossings. Measure the time difference between these points and convert it into degrees or radians using the signal’s frequency. The resulting value will represent the phase shift between the two signals.