
The world of cell phones and smartphones is constantly evolving, and with it, the importance of understanding analytics data becomes more crucial than ever. When it comes to iPhones, having insights into how users are interacting with your app or website is essential for making informed decisions and optimizing performance. However, navigating through the vast ocean of iPhone analytics data can be intimidating for many. That’s where this comprehensive guide comes in. In this article, we will dive deep into the world of iPhone analytics and show you how to read and understand the data effectively. From understanding user behavior and engagement metrics to deciphering acquisition and retention data, we will cover it all to empower you with the knowledge needed to make data-backed decisions for your iPhone applications or websites. So, let’s embark on this analytics journey and unlock the potential within your iPhone analytics data!
Inside This Article
- Overview of iPhone Analytics Data
- Understanding Key Metrics in iPhone Analytics Data
- Interpreting User Acquisition Analytics
- Analyzing User Engagement and Retention Metrics in iPhone Analytics Data
- Conclusion
- FAQs
Overview of iPhone Analytics Data
When it comes to measuring the success of your iPhone app, analytics data is a powerful tool. By analyzing this data, you can gain valuable insights into how users are interacting with your app, identify areas for improvement, and make data-driven decisions to optimize its performance. In this article, we will provide an overview of iPhone analytics data and delve into the key metrics and insights it can offer.
At its core, iPhone analytics data provides information about the usage and performance of your app. It reveals details such as the number of downloads, user engagement metrics, retention rates, conversion rates, in-app purchases, and more. This data is invaluable for understanding how your app is performing in the market and allows you to make informed decisions to enhance its user experience and drive app growth.
One of the primary metrics to pay attention to in iPhone analytics data is the number of downloads. This metric indicates the popularity of your app and gives you an idea of its reach. You can further analyze this data by segmenting it based on various factors like geographic location, device type, or referral source to gain insights into where and how users are discovering your app.
Another critical aspect of iPhone analytics data is user engagement metrics. These metrics provide insights into how users are interacting with your app and whether they find value in its features. Key engagement metrics include session length, screens per session, and in-app actions taken. By analyzing these metrics, you can identify areas of the app that are working well and areas where there may be opportunities to improve user engagement.
Retention rates are also important metrics to analyze in iPhone analytics data. Retention measures the percentage of users who return to your app after their initial interaction. By understanding retention rates, you can gauge the stickiness of your app and identify potential issues that may be causing users to abandon it. You can also compare the retention rates of different user segments to uncover patterns and trends.
Conversion rates are another key component of iPhone analytics data. Conversion measures the percentage of users who perform a desired action, such as making an in-app purchase or subscribing to a service. By tracking conversion rates, you can assess the effectiveness of your monetization strategies and identify areas for improvement. This data can help you optimize your app’s user experience and maximize revenue opportunities.
In summary, iPhone analytics data provides valuable insights into the usage and performance of your app. By analyzing key metrics such as downloads, user engagement, retention rates, and conversion rates, you can make informed decisions to enhance the user experience, improve app performance, and drive app growth. Understanding and utilizing this data is essential for app developers and marketers looking to stay competitive in the ever-evolving mobile app landscape.
Understanding Key Metrics in iPhone Analytics Data
iPhone analytics data provides valuable insights into the performance and usage patterns of your app. To make the most of this data, it’s crucial to understand the key metrics it offers. Let’s explore some of the key metrics you should pay attention to:
1. App Store Impressions
App Store impressions refer to the number of times your app listing is viewed by users in the App Store. This metric helps you gauge the visibility and attractiveness of your app to potential users. By monitoring app store impressions, you can make improvements to your app’s listing to increase its visibility and attract more users.
2. App Units
App units represent the total number of times your app has been downloaded or installed. This metric provides insight into the number of users who have installed your app. Monitoring app units allows you to track the growth and popularity of your app over time. By comparing app units with other metrics, such as app store impressions and user engagement, you can gain a deeper understanding of user behavior.
3. Active Devices
Active devices measure the number of unique devices that have interacted with your app during a specific time period. This metric helps you understand the reach of your app and the number of users who are actively using it. By tracking active devices, you can assess the effectiveness of marketing campaigns and identify potential areas for improvement.
4. Sessions
Sessions refer to the number of times users have interacted with your app. This metric helps you measure user engagement and the frequency of app usage. By analyzing session data, you can identify patterns and trends in user behavior, such as peak usage times or popular features. This information can guide you in enhancing the user experience and optimizing your app’s performance.
5. User Retention
User retention measures the percentage of users who continue to use your app over time. It provides insights into the long-term appeal and satisfaction of your app. By monitoring user retention, you can identify any drop-offs or churn rates among users. This information can help you identify areas of improvement and implement strategies to enhance user retention, such as delivering new features or addressing user feedback.
6. In-App Purchases
In-app purchases refer to the revenue generated through purchases made within the app. This metric helps you understand the monetization potential of your app and the effectiveness of your pricing strategies. By analyzing in-app purchase data, you can optimize your app’s pricing structure, offer targeted promotions, and enhance the overall user experience to encourage more in-app purchases.
Interpreting User Acquisition Analytics
When it comes to understanding the success of your iPhone app, user acquisition analytics provide valuable insights. These analytics help you determine how users discover and install your app, allowing you to make informed decisions to optimize your marketing efforts. Here are key metrics to focus on when interpreting user acquisition analytics.
1. Acquisition Channels: This metric identifies the channels through which users find your app. It includes organic search, referrals from other apps or websites, social media, and paid advertisements. By analyzing these channels, you can allocate your marketing budget effectively and focus on the channels that generate the most conversions.
2. Cost Per Install (CPI): CPI measures the cost of acquiring each user. By dividing your total marketing spend by the number of installs, you can determine the effectiveness and efficiency of your user acquisition campaigns. A lower CPI indicates cost-effective campaigns, while a higher CPI may require adjustments to maximize your budget.
3. Conversion Rate: This metric measures the percentage of users who install your app after viewing your marketing materials, such as an advertisement or app store listing. A high conversion rate indicates strong user interest and effective messaging, while a low conversion rate may require optimizing your app’s visuals, descriptions, or targeting strategies.
4. Cohort Analysis: Cohort analysis allows you to analyze groups of users who installed your app during a specific period. By tracking their behavior over time, you can understand their retention rate, revenue generation, and engagement levels. This helps you identify the most valuable user segments and tailor your marketing efforts accordingly.
5. Return On Investment (ROI): ROI measures the monetary returns generated from your user acquisition efforts. By comparing your marketing costs to the revenue generated by the acquired users, you can assess the profitability of your campaigns. This data enables you to optimize your marketing budget allocation, focusing on channels and campaigns that provide the highest return.
6. Retention Rate: Retention rate indicates the percentage of users who continue to use your app over a specific period. By analyzing retention rate, you can evaluate user satisfaction and identify opportunities for improvements, such as enhancing user experience or implementing retention-focused features.
By thoroughly analyzing and interpreting user acquisition analytics, you can make data-driven decisions to improve your app’s visibility, attract more users, and maximize your return on investment. Understanding these metrics will provide valuable insights into the effectiveness of your marketing efforts and guide your strategy for sustainable growth.
Analyzing User Engagement and Retention Metrics in iPhone Analytics Data
When it comes to analyzing user engagement and retention metrics in iPhone analytics data, there are several key metrics that can provide valuable insights into how users interact with your app and whether they continue to use it over time. Understanding these metrics can help you optimize your app and improve user retention. Let’s take a closer look at some of the important metrics to consider.
1. User Retention: User retention is a crucial metric that measures how well your app is able to retain users over a specific period of time. It provides insight into whether your app is able to engage users and keep them coming back. By tracking user retention, you can identify potential issues and make improvements to enhance the user experience.
2. Session Duration: Session duration measures the length of time that users spend in your app during each session. This metric helps you understand how engaged users are with your app and can indicate whether they find value and enjoyment in using it. Longer session durations typically indicate higher user engagement.
3. Frequency of Use: The frequency of use metric measures how often users open and interact with your app. It provides valuable information about how frequently users find your app useful and how it fits into their daily routines. Monitoring this metric can help you understand user habits and tailor your app’s features to better meet their needs.
4. Screen Flow Analysis: Screen flow analysis allows you to visualize the paths that users take within your app and identify any points of friction or drop-offs. By analyzing the screen flow, you can optimize the user journey and ensure a seamless and intuitive experience. This can lead to higher user engagement and improved retention.
5. Event Tracking: Event tracking allows you to measure specific actions or events within your app, such as completing a purchase or sharing content. By tracking these events, you can gain insights into user behavior and identify areas for improvement. For example, if a significant number of users abandon the checkout process, you can identify any hurdles and make the necessary adjustments to increase conversions.
6. Feature Usage: Understanding which features of your app are most popular and frequently used can provide insights into what users find valuable. By analyzing feature usage, you can identify opportunities to further enhance those features and prioritize improvements based on user preferences.
7. Average Revenue per User: This metric measures the average revenue generated by each user. It helps you understand the profitability of your app and the value it provides to users. By monitoring this metric, you can identify potential strategies to increase user monetization and maximize revenue.
Conclusion
Understanding and analyzing iPhone analytics data is crucial for optimizing the performance of your mobile app. By delving into the wealth of information provided by these analytics, you can make informed decisions to enhance user experience, drive user engagement, and improve your app’s overall success.
From monitoring key metrics like downloads, sessions, and retention rates to tracking user behavior and uncovering valuable insights, iPhone analytics give you the power to make data-driven decisions. Whether you’re a developer, marketer, or business owner, harnessing the power of iPhone analytics can empower you to identify areas for improvement, make iterative changes, and ultimately drive the success of your app.
Remember, the key lies not only in collecting the data but also in how you interpret and utilize it. So, dive into your iPhone analytics, explore the patterns, and utilize the insights to optimize your app and deliver a stellar user experience.
FAQs
1. Why is it important to understand iPhone analytics data?
Understanding iPhone analytics data provides invaluable insights into user behavior, app performance, and user engagement. It helps developers and marketers make informed decisions to improve their app’s user experience, drive user acquisition, and increase retention.
2. What kind of data can I analyze from iPhone analytics?
iPhone analytics provides a wide range of data to analyze, including user demographics, app usage metrics, conversion rates, retention rates, and in-app purchase data. You can track the number of active users, sessions, screen views, and user engagement metrics such as session duration and screen depth.
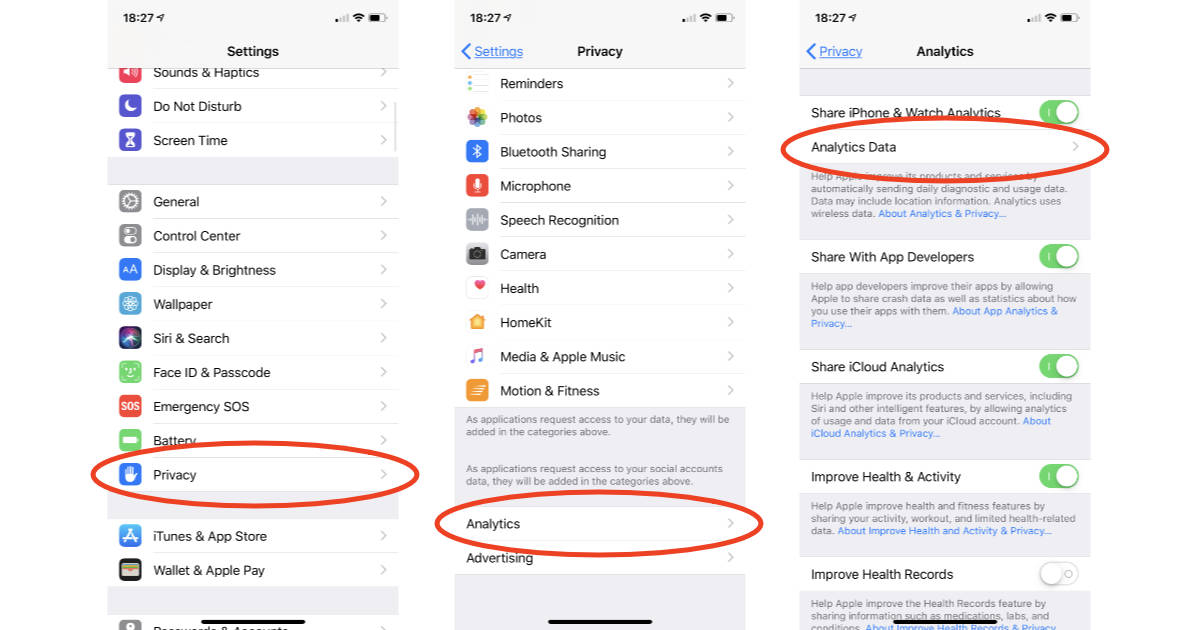
3. How can I access iPhone analytics data?
iPhone analytics data can be accessed through the App Store Connect platform. Once you have access to your app’s analytics, you can navigate through various sections to view and analyze different metrics in detail. It provides customizable reports, charts, and graphs to help you gain insights into your app’s performance.
4. What are some essential metrics to track in iPhone analytics?
Some essential metrics to track in iPhone analytics include user acquisition, user engagement, retention rates, in-app purchases, and crash reports. User acquisition metrics can help you understand how users discover and install your app. User engagement metrics give insights into how users interact with your app, how often they use it, and for how long. Retention rates provide information about user loyalty over time, in-app purchases indicate revenue generation, and crash reports help you identify and fix technical issues.
5. How can I use iPhone analytics data to improve my app’s performance?
By closely analyzing iPhone analytics data, you can identify areas of improvement and make data-driven decisions to enhance your app’s performance. For example, if you notice high user drop-off rates on a specific screen, you can redesign that screen to improve user experience. If users are not completing a specific conversion goal, you can optimize that process. By understanding user behavior and preferences, you can implement changes that cater to their needs and ensure a better app experience overall.