
Are you looking for a simple and effective way to analyze ELISA data in Excel? Look no further! In this article, we will guide you through the process of analyzing ELISA data step by step, using the power of Excel. ELISA, or enzyme-linked immunosorbent assay, is a commonly used laboratory technique for detecting and measuring proteins in biological samples.
By analyzing ELISA data in Excel, you can perform various calculations, generate graphs, and make meaningful interpretations. Whether you are a student, researcher, or scientist, being able to effectively analyze ELISA data in Excel will enhance your data analysis skills and facilitate your research process. Follow along as we uncover useful tips, tricks, and techniques to make the most out of your ELISA data analysis journey!
Inside This Article
- Overview of ELISA Data Analysis in Excel
- Prerequisites for Analyzing ELISA Data in Excel
- Importing and Preparing ELISA Data in Excel
- Calculating Background Subtraction and Blank Correction
- Constructing Standard Curves and Determining Sample Concentrations
- Analyzing Replicates and Calculating Mean Values
- Assessing Assay Precision and Accuracy
- Performing Statistical Analysis on ELISA Data
- Generating Visualizations to Interpret ELISA Data
- Conclusion
- FAQs
Overview of ELISA Data Analysis in Excel
ELISA (Enzyme-Linked Immunosorbent Assay) is a widely used technique in life science research and diagnostics to detect and measure the presence of specific proteins or antibodies. The analysis of ELISA data involves several steps, including data import, background subtraction, constructing standard curves, calculating sample concentrations, analyzing replicates, performing statistical analysis, and generating visualizations. With the power of Excel, these steps can be efficiently executed and interpreted to gain valuable insights.
Excel is a versatile tool that offers a wide range of features and functions that make it ideal for ELISA data analysis. Its ability to handle large datasets, perform calculations, and generate visualizations provides researchers and analysts with the necessary tools to accurately interpret the results of ELISA experiments.
By using Excel for ELISA data analysis, researchers can easily organize and manipulate their data, perform calculations, and make comparisons between different samples. Excel’s formula and mathematical functions allow for the calculation of background subtraction, blank correction, determination of sample concentrations, and analysis of replicates. The statistical functions in Excel enable assessment of assay precision and accuracy, as well as the generation of p-values and confidence intervals for hypothesis testing.
One of the benefits of using Excel for ELISA data analysis is its compatibility with other software and platforms. Data exported from ELISA plate reader software can be seamlessly imported into Excel, allowing easy integration with other research tools or data analysis software. This flexibility enables researchers to create customized workflows and access the full range of Excel’s data manipulation and analysis capabilities.
Prerequisites for Analyzing ELISA Data in Excel
Before you dive into analyzing ELISA data in Excel, it is crucial to ensure that you have the necessary prerequisites in place. These prerequisites include:
1. Reliable and Accurate ELISA Data: Make sure that you have collected accurate and reliable ELISA data. The data should include measurements of sample absorbance or fluorescence readings and corresponding concentrations.
2. ELISA Kit Software or Manual: Obtain the ELISA kit software or manual provided by the manufacturer. Familiarize yourself with the instructions and guidelines provided to ensure accurate data analysis.
3. Microsoft Excel: Install Microsoft Excel on your computer. The ELISA data analysis techniques described in this guide are specifically tailored for Excel. It is recommended to use the latest version of Excel for optimal functionality.
4. Basic Understanding of Excel Functions and Formulas: Having a basic understanding of Excel functions and formulas will greatly assist you in efficiently analyzing ELISA data. Familiarize yourself with functions such as SUM, AVERAGE, IF, and VLOOKUP, as they will be used in various steps of the analysis.
5. Data Organization: Ensure that your ELISA data is organized in a structured format. This includes having separate columns for sample names, concentrations, absorbance or fluorescence readings, and any additional variables you may want to analyze.
6. Active Data Connection: Confirm that you have an active data connection on your computer. This is necessary for importing the ELISA data into Excel and performing subsequent analysis tasks.
By fulfilling these prerequisites, you will be well-prepared to embark on the journey of analyzing ELISA data using Excel. With the right tools and a solid understanding of the process, you will be able to derive valuable insights and make informed decisions based on your ELISA results.
Importing and Preparing ELISA Data in Excel
When it comes to analyzing ELISA data, importing and preparing the data in Excel is the crucial first step. This process allows you to organize and manipulate the data effectively for further analysis. Here are the key steps to follow:
1. Open Microsoft Excel and create a new workbook or open an existing one where you want to import the ELISA data.
2. Go to the “Data” tab in the Excel menu and click on “From Text/CSV” if your ELISA data is in a CSV format. If you have the data in another format, such as an Excel file or a text file, choose the corresponding option.
3. A file explorer window will open. Navigate to the location where your ELISA data file is saved and select it. Click on “Import” to continue.
4. The “Text Import Wizard” will open, allowing you to specify the type of data and the delimiter used in the file. Follow the wizard’s instructions to correctly import the data into Excel. Make sure to preview the data to ensure it imports correctly.
5. Once the data is imported, you may need to clean and format it. Remove any unnecessary rows or columns that don’t contain relevant data for your analysis.
6. Check for any missing values or errors in the data. If there are any, consider how to handle them: either by removing the affected data points or by using imputation methods to estimate the missing values.
7. If your ELISA data includes multiple assays or experiments, create separate sheets or tabs in your Excel workbook for each one. This helps to keep the data organized and makes it easier to analyze later on.
8. Finally, ensure that the data is properly labeled. Assign appropriate headers to each column to indicate the variables or experimental conditions being measured. This will help in interpreting the data accurately during analysis.
By following these steps, you can successfully import and prepare your ELISA data in Excel, laying the foundation for further exploration and analysis of your results.
Calculating Background Subtraction and Blank Correction
Calculating background subtraction and blank correction is a crucial step in analyzing ELISA data in Excel. It helps to eliminate any non-specific signal present in the assay, ensuring accurate measurement of the target analyte.
The background signal often arises from components in the samples or reagents that can interfere with the assay. By subtracting the background signal from sample readings, you can isolate the specific analyte signal and obtain more accurate results.
To calculate background subtraction and blank correction in Excel, follow these steps:
- Identify the blank samples: These are samples that contain all the assay components except for the analyte. Typically, multiple blank samples are included in the assay.
- Measure the absorbance or fluorescence of the blank samples: Use a spectrophotometer or a plate reader to obtain the readings of the blank samples. Record these values in a designated column in your Excel spreadsheet.
- Subtract the blank values from the corresponding sample readings: In a separate column, subtract the absorbance or fluorescence values of the blank samples from the respective sample readings.
- Apply the blank correction to all sample readings: Once you have obtained the corrected values by subtracting the blank signals, you can now use these corrected values for further analysis and interpretation.
It is important to note that accurate blank readings are essential for reliable background subtraction and correction. The blank samples should represent the same matrix and conditions as the samples being analyzed. This helps to account for any inherent background signals present in the assay system.
By performing background subtraction and blank correction, you can minimize the impact of non-specific signal and improve the accuracy and reliability of your ELISA data analysis in Excel.
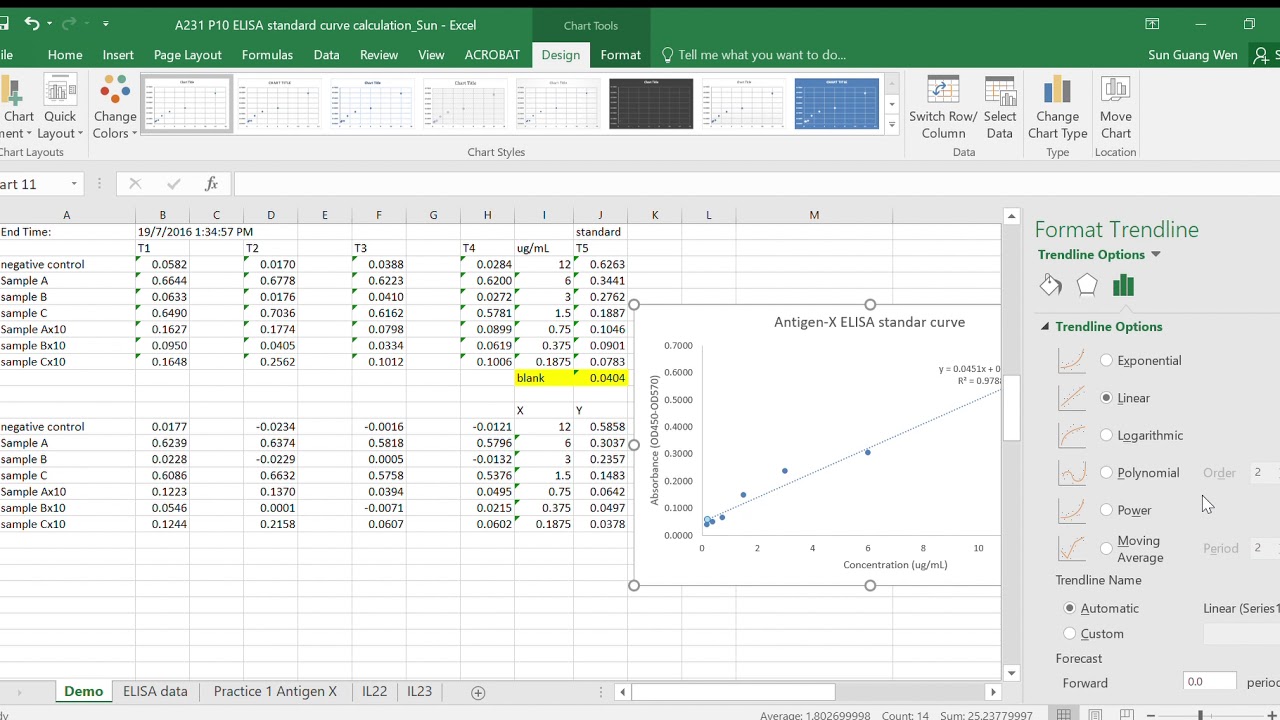
Constructing Standard Curves and Determining Sample Concentrations
Constructing standard curves is a crucial step in ELISA data analysis as it allows for the quantification of sample concentrations. Standard curves are created by plotting the known concentrations of standard solutions against their corresponding absorbance or optical density (OD) values.
To construct a standard curve, start by preparing a series of dilutions of known concentrations of the target analyte. These dilutions should cover a suitable range, including concentrations above and below the expected concentration of the samples to be analyzed.
Next, perform the ELISA assay on the standard solutions, following the same protocol as used for the sample analysis. Measure the absorbance or OD values for each standard solution using a spectrophotometer.
Once the absorbance or OD values for the standards are obtained, plot a graph with the concentration of the standard solutions on the x-axis and the corresponding absorbance or OD values on the y-axis. Fit a curve to the data points using a suitable regression model, such as a linear or logarithmic regression.
After constructing the standard curve, you can use it to determine the concentrations of the samples. Measure the absorbance or OD values of the samples and plot them on the same graph as the standard curve. The concentration of each sample can then be determined by interpolating the absorbance or OD value on the curve and reading off the corresponding concentration value.
It is important to note that the accuracy of the sample concentrations determined from the standard curve is dependent on the quality of the curve fit and the linearity of the assay. Therefore, it is recommended to include quality control samples of known concentrations in each ELISA run to assess the performance of the curve and ensure the accuracy of the sample quantification.
Analyzing Replicates and Calculating Mean Values
When analyzing ELISA data, it is common to have multiple replicates for each sample to ensure the accuracy and reliability of the results. Analyzing these replicates involves calculating the mean values, which provide a more representative measurement of the samples.
To calculate the mean values, start by gathering the data from the replicates. This can be done by organizing the data for each sample in separate columns or rows, with each replicate in its own cell. Make sure the replicates are clearly labeled to avoid confusion during analysis.
Once the data is organized, you can proceed to calculate the mean value. Simply add up the values from each replicate and divide the sum by the number of replicates. This will give you the average value for that sample.
For example, if you have three replicates with values of 5, 7, and 6, you would add them together (5 + 7 + 6 = 18) and divide by 3 (the number of replicates), resulting in a mean value of 6.
Calculating the mean values not only provides a central measurement for each sample but also helps to minimize the effect of random variations or outliers in the data. By taking the average of multiple replicates, you can obtain a more reliable and representative result.
After calculating the mean values, it is important to record and use these values for further analysis, such as determining sample concentrations or performing statistical tests. The mean values serve as a crucial reference for comparing and interpreting the results obtained from ELISA assays.
In addition to calculating the mean values, it is also beneficial to calculate other statistical parameters, such as standard deviation, to assess the variability of the replicates. These parameters can provide insights into the precision and accuracy of the assay.
By analyzing replicates and calculating mean values, you can ensure the reliability and accuracy of your ELISA data. This step is essential in obtaining meaningful and interpretable results, making it a crucial part of the overall ELISA data analysis process.
Assessing Assay Precision and Accuracy
Assessing the precision and accuracy of an ELISA assay is crucial to ensure reliable and consistent results. Precision refers to the consistency or reproducibility of measurements, while accuracy refers to how close the measurements are to the true or expected values.
To assess assay precision, it is important to analyze the replicates within the assay. Replicates are multiple measurements taken for the same sample or standard. By calculating the coefficient of variation (CV), which is the standard deviation divided by the mean, you can determine the variability within the replicates. The smaller the CV, the higher the precision of the assay.
In addition to assessing precision, accuracy can be evaluated by comparing the measured values to the known or expected values. This is typically done by using certified reference materials or samples with known concentrations. By calculating percent recovery, which is the measured value divided by the expected value multiplied by 100, you can determine how close the measurements are to the true values. A higher percent recovery indicates a higher level of accuracy.
It is important to note that while precision and accuracy are related, they are not the same concept. A precise assay can produce consistent measurements, but those measurements may not necessarily be close to the true values. Conversely, an accurate assay can produce measurements that are close to the true values, but they may not be consistent.
Assessing the precision and accuracy of an ELISA assay can help identify any systematic errors or variability in the measurements. This information can guide optimization efforts and ensure the reliability and validity of the assay results. By consistently monitoring and improving assay precision and accuracy, researchers can have confidence in the data generated from their ELISA experiments.
Performing Statistical Analysis on ELISA Data
Statistical analysis plays a crucial role in interpreting ELISA data. By applying statistical tests, we can determine the significance of differences between sample groups and assess the overall quality and reliability of our results. Here, we will explore some commonly used statistical analysis techniques for ELISA data.
1. t-test: The t-test is a parametric statistical test used to compare means between two groups. In ELISA experiments, it can be used to determine if there is a significant difference between the experimental group and a control group.
2. One-Way ANOVA: One-Way Analysis of Variance (ANOVA) is a statistical test used to compare means among three or more independent groups. This test can be used in ELISA experiments to assess if there are significant differences in mean values among different experimental groups.
3. Two-Way ANOVA: Two-Way ANOVA is an extension of One-Way ANOVA that allows for the simultaneous assessment of two independent variables. In ELISA experiments, it can be beneficial when studying the impact of two factors, such as treatment and time, on the measured analyte.
4. Nonparametric tests: Nonparametric tests, such as the Mann-Whitney U test or the Kruskal-Wallis test, are used when the assumptions of normality and equal variances cannot be met. These tests are useful in ELISA data analysis when the data is not normally distributed or the sample sizes are small.
5. Regression analysis: Regression analysis is used to determine the relationship between two variables. In ELISA data analysis, regression analysis can be used to assess the relationship between the concentration of the analyte and various experimental factors, such as the incubation time or the concentration of a specific reagent.
It is important to note that the choice of statistical analysis techniques depends on the research question, experimental design, and characteristics of the ELISA data. Consultation with a statistician or a statistical software package can help determine the most appropriate analysis methods for your specific study.
Generating Visualizations to Interpret ELISA Data
Once you have performed the necessary calculations and analysis on your ELISA data in Excel, the next step is to generate visualizations that will help you interpret the results. Visualizations can provide a clearer understanding of the data and enable you to identify trends, patterns, and outliers more easily.
There are various types of visualizations that you can use to analyze and present ELISA data, depending on the specific requirements of your study or experiment. Here are a few commonly used visualizations:
- Bar Charts: Bar charts are a simple and effective way to compare the concentrations of different samples or groups. You can use bar charts to visualize the mean or median values of each group, with error bars indicating the variability.
- Line Graphs: Line graphs are particularly useful for tracking changes in concentration over time or across different experimental conditions. They allow you to visually represent the progression of the data and identify any trends or patterns.
- Scatter Plots: Scatter plots are ideal for comparing the correlation between two variables. In ELISA data analysis, scatter plots can be used to examine the relationship between sample concentration and optical density, enabling you to assess the assay’s linearity.
- Box Plots: Box plots provide a visual representation of the distribution of data, including the median, quartiles, and any outliers. They are useful for comparing the variability and skewness of different sample groups.
- Heatmaps: Heatmaps are effective in displaying the relative concentrations of multiple analytes or the interactions between different experimental conditions. Heatmaps use color gradients to depict the intensity of the response, allowing for quick and easy interpretation.
When generating visualizations in Excel, you can utilize the built-in charting tools or explore additional add-ins and plugins that provide more advanced visualization options. Ensure that your visualizations are visually appealing, easy to interpret, and accurately represent the underlying data.
By visualizing your ELISA data in Excel, you can gain valuable insights into the results of your experiments and communicate your findings more effectively. These visualizations can enhance your data analysis process, aiding in the understanding and interpretation of the data.
Conclusion
In conclusion, analyzing Elisa data in Excel can provide researchers with valuable insights and statistical information. By following the step-by-step process outlined in this article, you can effectively organize, visualize, and interpret your Elisa data using Excel’s powerful features.
With Excel’s functionality for data manipulation and visualization, you can easily analyze your Elisa data, perform statistical calculations, and generate meaningful graphs and charts. This enables you to effectively communicate your results and make informed decisions based on your experimental findings.
Remember to carefully validate your data, use appropriate statistical tests, and consider any potential limitations of the Elisa technique. By adhering to good data analysis practices, you can ensure the accuracy and reliability of your results.
By leveraging Excel’s capabilities, researchers can save time and effort while obtaining valuable insights from their Elisa experiments. So, start analyzing your Elisa data in Excel and unlock the potential of your research!
FAQs
Q: Can I analyze ELISA data in Excel?
Yes, Excel is a versatile tool that can be used to analyze ELISA data. With its powerful data manipulation and analysis features, you can perform calculations, generate graphs and charts, and derive meaningful insights from your ELISA data.
Q: What are the steps to analyze ELISA data in Excel?
To analyze ELISA data in Excel, you can follow these steps:
1. Import your ELISA data into an Excel spreadsheet.
2. Clean up the data, removing any unnecessary columns or rows.
3. Calculate the average of the replicates for each sample.
4. Calculate the standard deviation for each sample.
5. Plot a standard curve using the known concentrations of your standards.
6. Use the standard curve to determine the concentrations of your unknown samples.
7. Perform any additional calculations or statistical analyses as needed.
8. Present your results using graphs or tables.
Q: Can I use Excel to plot standard curves for ELISA data?
Yes, Excel provides various charting capabilities that allow you to plot standard curves for your ELISA data. You can plot a scatter plot with the concentration on the x-axis and the signal intensity on the y-axis. By fitting a trendline to the data points, you can obtain the equation to calculate the concentration of unknown samples based on their signal intensity.
Q: Are there any Excel add-ins or templates available specifically for ELISA data analysis?
Yes, there are several Excel add-ins and templates available that can simplify the process of analyzing ELISA data. These tools offer pre-built functions, data analysis templates, and automated workflows, saving you time and effort. Some popular ELISA data analysis add-ins include ELISA Data Analysis Software (ELDA) and SoftMax Pro.
Q: Are there any limitations to analyzing ELISA data in Excel?
While Excel is a powerful tool for data analysis, it does have some limitations when it comes to ELISA data analysis. Excel may struggle with very large datasets, and complex calculations may be slower on older versions of Excel. Additionally, Excel is not specifically designed for ELISA data analysis, so there may be some limitations in terms of specialized statistical analysis or advanced data visualization. In such cases, it may be beneficial to consider using dedicated ELISA data analysis software.