
If you are conducting research in the field of biology or related sciences, analyzing Elisa data is a crucial step in your experimental process. Elisa, short for Enzyme-Linked Immunosorbent Assay, is a commonly used laboratory technique to detect and quantify proteins or antibodies in biological samples. The data obtained from an Elisa assay provides valuable insights into various biological and biomedical applications.
In this article, we will explore the essential steps required to effectively analyze Elisa data. From data normalization and standard curve construction to calculating sample concentrations and interpreting the results, we will provide you with a comprehensive guide to ensure accurate and meaningful conclusions from your Elisa experiments. So, whether you are new to Elisa analysis or looking to enhance your skills, read on to discover the insights and techniques that will help you make the most of your Elisa data.
Inside This Article
- Overview of ELISA Data Analysis
- Preparing the Data for Analysis
- Statistical Analysis Techniques for ELISA Data
- Interpreting and Reporting ELISA Results
- Conclusion
- FAQs
Overview of ELISA Data Analysis
The Enzyme-Linked Immunosorbent Assay (ELISA) is a widely used technique in the field of biomedical research and diagnostics. It is used to detect and quantify the presence of specific proteins or antibodies in a sample. ELISA data analysis plays a crucial role in interpreting and reporting the results obtained from this assay.
The process of ELISA data analysis involves several steps, starting from the collection of data during the assay, followed by data preparation, statistical analysis, and interpretation of results. Each of these steps is essential for obtaining accurate and reliable information from the ELISA experiment.
During the data collection stage, the absorbance values or fluorescence intensities are measured for the samples and standards. These readings are then used to calculate the concentration of the target protein or antibody in the sample. The data obtained is often presented in the form of a standard curve, which is used to determine the sample concentrations.
Next, the data needs to be prepared for analysis. This involves organizing the data into a suitable format, ensuring that all the necessary information is included. It is important to have a clear understanding of the experimental design, including the sample sizes, controls, and replicates.
Statistical analysis techniques are then applied to the prepared data. These techniques help in analyzing the variation within the data, determining the significance of the results, and identifying any patterns or trends. Common statistical methods used in ELISA data analysis include t-tests, ANOVA, and regression analysis.
Interpreting and reporting the ELISA results is the final step in the data analysis process. The results are usually reported as concentrations or relative values, along with measures of uncertainty such as standard deviations or confidence intervals. It is important to provide a clear and concise summary of the findings, highlighting any significant differences or trends observed.
Preparing the Data for Analysis
Before diving into the analysis of ELISA data, it is crucial to properly prepare the data to ensure accurate and reliable results. Here are some essential steps to follow when preparing your ELISA data for analysis:
1. Data Cleaning: Start by examining the raw data for any inconsistencies or errors. Remove any duplicates, outliers, or missing values. This step is crucial to ensure that the data you analyze is clean and reliable.
2. Data Formatting: Ensure that your data is properly formatted for analysis. Convert any measurements or concentrations into a consistent unit of measurement. It is also important to label your data columns accurately for clarity.
3. Data Organization: Organize your data in a logical and structured manner. Use spreadsheets or software tools to arrange your data in a tabular format, where each row represents a sample or observation, and each column represents a variable or measurement.
4. Quality Control: Conduct a quality control check on your data to identify any potential errors or inconsistencies. This can include performing statistical tests or visualizations to ensure the integrity of your data.
5. Data Normalization: If you have multiple samples or experimental conditions, it is crucial to normalize your data to account for any variations in sample size or experimental conditions. Normalization helps to standardize the data and enables meaningful comparisons between samples.
6. Data Transformation: Depending on the distribution and nature of your data, you might need to apply data transformations to meet the assumptions of the analysis techniques you plan to use. Common transformations include log transformations or square root transformations.
7. Data Verification: Before proceeding with analysis, carefully verify your data to ensure that all the necessary variables and measurements are present. Check for any discrepancies or missing values and address them appropriately.
8. Data Backup: Always make a backup of your cleaned and organized data. This ensures that you have a copy of the original data and allows you to retrace your steps if needed.
By following these steps to prepare your ELISA data for analysis, you can ensure the accuracy and reliability of your results. Proper data preparation sets a solid foundation for the subsequent statistical analysis techniques that you will employ.
Statistical Analysis Techniques for ELISA Data
ELISA (Enzyme-Linked Immunosorbent Assay) is a widely used method for detecting and quantifying proteins or other molecules in biological samples. Once the ELISA experiment is performed and the data is collected, it is important to perform statistical analysis to derive meaningful insights from the results. In this section, we will explore some of the commonly used statistical analysis techniques for ELISA data.
1. Descriptive Statistics: The first step in analyzing ELISA data is to summarize the data using descriptive statistics. This includes calculating measures like mean, median, and standard deviation to understand the central tendency and variability of the data.
2. T-Test: The t-test is a statistical test used to compare the means of two groups. In the context of ELISA data, the t-test can be used to determine if there is a significant difference in the measured values between two sample groups, such as a control group and a treatment group.
3. ANOVA: Analysis of Variance (ANOVA) is a statistical test used to compare the means of multiple groups. In ELISA analysis, ANOVA can be applied when there are more than two sample groups. It helps determine if there are any significant differences in the measured values across the groups.
4. Regression Analysis: Regression analysis is used to determine the relationship between variables. In ELISA data analysis, regression analysis can be used to establish a correlation between the concentration of the molecule being measured and other variables, such as time or dosage.
5. Correlation Analysis: Correlation analysis is used to measure the strength and direction of the relationship between two variables. In ELISA data analysis, correlation analysis can help determine if there is a significant relationship between the concentration of the molecule being measured and another variable of interest.
6. Graphical Representation: Visualizing the data through plots and graphs can provide a clearer understanding of the results. Commonly used graphical representations for ELISA data analysis include bar charts, scatter plots, and line graphs.
7. Confidence Intervals: Confidence intervals provide a range of values within which the true population parameter is likely to lie. Calculating confidence intervals for ELISA data can help determine the precision and accuracy of the estimated values.
It is important to note that the choice of statistical analysis technique may vary depending on the specific research question, experimental design, and data characteristics. Consulting with a statistical expert or using specialized statistical software can further enhance the accuracy and reliability of ELISA data analysis.
Interpreting and Reporting ELISA Results
After performing an ELISA assay and obtaining the results, the next crucial step is to interpret and report the findings accurately. This step is vital as it provides valuable insights into the presence and concentration of the target analyte in the sample under investigation.
Here are some key points to consider when interpreting and reporting ELISA results:
1. Understand the Assay Design: Before interpreting the results, it is important to have a strong understanding of the ELISA assay design. This includes knowing the purpose of the assay, the specificity of the antibodies used, and the appropriate controls employed to validate the results.
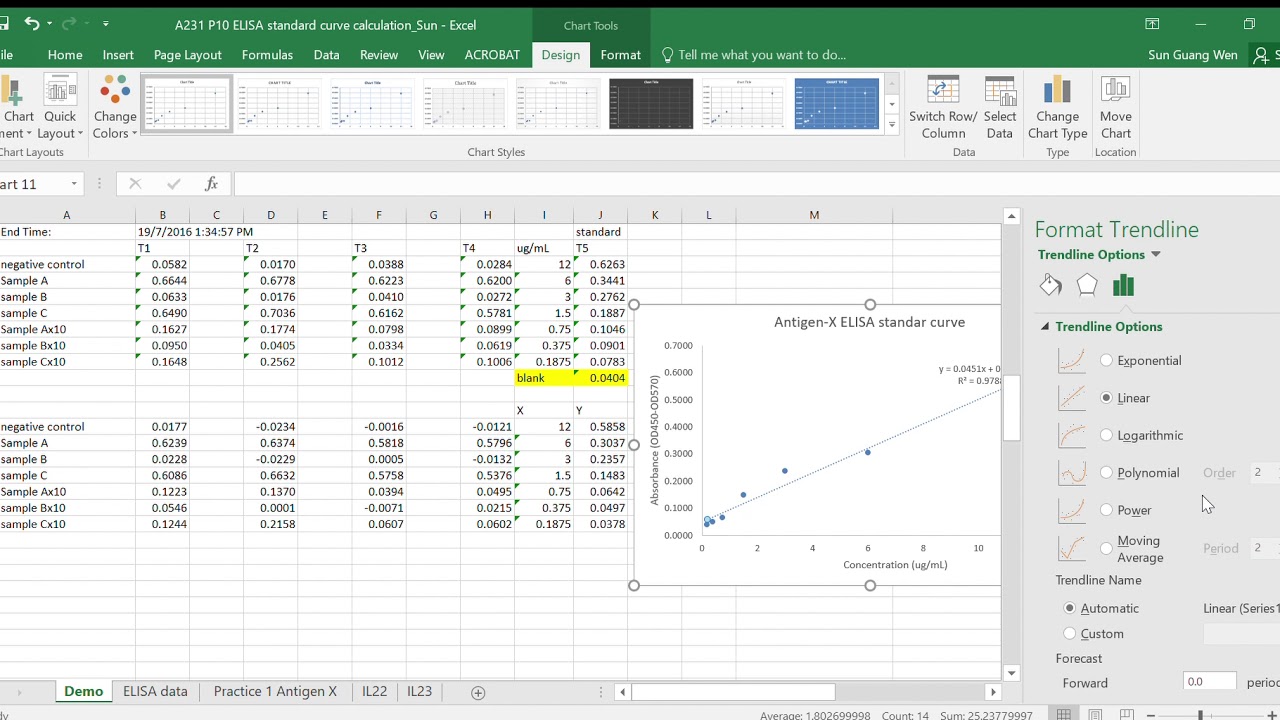
2. Analyze the Standard Curve: The standard curve is a graph that plots the known concentrations of the standard samples against their respective optical densities. By comparing the sample optical densities to the standard curve, you can determine the concentration of the target analyte in the test samples.
3. Consider the Detection Limit: The detection limit refers to the lowest concentration of analyte that can be reliably detected by the ELISA assay. If the measured optical density of a sample falls below the detection limit, it is important to report it as “below the detection limit” or “non-detectable.”
4. Evaluate the Signal-to-Noise Ratio: The signal-to-noise ratio assesses the quality and reliability of the assay by comparing the signal (optical density of the analyte) to the background noise (optical density of the negative control). A high signal-to-noise ratio indicates a robust assay with minimal interference from non-specific binding.
5. Compare Results to Validated Reference Ranges: It is essential to compare the obtained results with validated reference ranges or known standards to determine whether the analyte concentration is within the expected range. Deviations from the reference range could indicate the presence of disease or other abnormalities.
6. Consider Biological Variability: Biological variability can play a role in the interpretation of ELISA results. It is important to understand the expected variability within a population and consider factors like age, gender, and health status when interpreting the results.
7. Report Results Clearly and Accurately: When reporting ELISA results, make sure to present the data in a clear and concise manner. Include key information such as the analyte concentration, units of measurement, sample identifiers, and any deviations from the reference range or detection limit. Providing a comprehensive and well-structured report will ensure that the findings can be easily understood and utilized by other researchers or healthcare professionals.
By following these guidelines, you can effectively interpret and report your ELISA results, providing accurate and meaningful information about the target analyte in your samples. Remember, proper interpretation and reporting are vital for the success and impact of your research or clinical study.
Conclusion
In conclusion, analyzing Elisa data is a crucial step in the field of scientific research. By carefully examining and interpreting the results, researchers can gain valuable insights into various biological processes and diseases. Through the use of statistical methods, data visualization techniques, and the application of appropriate controls, researchers can draw meaningful conclusions from their experiments.
During the analysis, it is important to consider factors such as background noise, standard curves, sample dilution, and data normalization. Additionally, the use of appropriate statistical tests and software tools can help in accurately assessing the significance of the results.
Overall, successful Elisa data analysis requires a combination of technical expertise, attention to detail, and critical thinking skills. By following standard protocols and implementing rigorous analysis methods, researchers can ensure the reliability and reproducibility of their findings, contributing to the advancement of scientific knowledge and the development of new therapies and treatments.
FAQs
1. What is Elisa data analysis?
Elisa data analysis is a process of interpreting and extracting meaningful insights from the raw data obtained from an Elisa experiment. It involves statistical analysis, normalization, curve fitting, and calculating various parameters such as concentration, absorbance, or fluorescence intensity.
2. Why is Elisa data analysis important?
Elisa data analysis is important because it allows researchers to determine the concentration of a specific antigen or antibody in a sample. It helps in studying immune responses, disease diagnosis, drug discovery, and monitoring biochemical processes.
3. What are the main steps involved in Elisa data analysis?
The main steps involved in Elisa data analysis include data preprocessing, background subtraction, standard curve fitting, sample quantification, statistical analysis, and result interpretation. Each step is crucial in obtaining accurate and reliable results.
4. What software/tools can be used for Elisa data analysis?
There are several software and tools available for Elisa data analysis, such as GraphPad Prism, Microsoft Excel, R language, and BioTek Gen5 software. It is essential to choose the appropriate tool based on your specific requirements and the complexity of your data.
5. How can I improve the accuracy of Elisa data analysis?
To improve the accuracy of Elisa data analysis, it is important to optimize the experimental parameters, such as incubation times, temperatures, and assay reagent concentrations. Properly calibrating the spectrophotometer or plate reader is also crucial. Additionally, using appropriate statistical methods and replicating the experiments can increase the reliability of your results.