
When conducting research, one of the crucial aspects is analyzing and presenting demographic data. Demographic data refers to information about the characteristics of a population, such as age, gender, education level, income, and more. Effectively presenting this data is essential for researchers to gain insights, draw conclusions, and make informed decisions.
In this article, we will explore various methods and techniques to present demographic data in research. We will delve into the importance of visual representation, such as charts, graphs, and maps, and discuss the significance of using appropriate labels and titles. We will also touch upon the importance of providing context and presenting data in a relatable and understandable manner.
Whether you are a student working on a research project or a professional researcher, this article will provide you with valuable tips and strategies to present demographic data effectively, making your research findings more engaging and impactful.
Inside This Article
- Overview
- Importance of Presenting Demographic Data
- Methods for Presenting Demographic Data
- Common Challenges in Presenting Demographic Data
- Conclusion
- FAQs
Overview
Presenting demographic data is a crucial aspect of research studies across various fields. Whether you’re conducting a market research survey, analyzing public health data, or studying social trends, understanding how to effectively present demographic data is essential. In this article, we will explore the importance of presenting demographic data, discuss different methods for doing so, and address common challenges that researchers may face in this process.
Demographic data refers to information about a particular population or group, such as age, gender, ethnicity, income, education level, and more. By examining demographic characteristics, researchers can gain valuable insights into patterns, trends, and disparities within a population. It helps to identify and analyze target audiences, understand consumer behavior, inform policy decisions, and track changes over time.
When presenting demographic data, the goal is to effectively communicate the findings in a clear, concise, and visually appealing manner. This involves organizing the data in a way that is easy to understand for both experts and non-experts alike. Different methods and techniques can be used to accomplish this, including charts, graphs, tables, infographics, and narrative descriptions.
However, presenting demographic data can pose challenges. It is important to ensure the accuracy and reliability of the data, as well as maintain privacy and confidentiality for the individuals or groups being studied. Additionally, researchers must consider the cultural context, potential biases, and ethical considerations while presenting demographic data.
In the following sections, we will delve deeper into the significance of presenting demographic data, explore various methods that can be employed, and address some common challenges researchers may encounter along the way.
Importance of Presenting Demographic Data
When conducting research, presenting demographic data is of paramount importance. Demographic data refers to information that provides insights into the characteristics and attributes of a specific population or group. It includes data such as age, gender, ethnicity, income level, educational background, and more. While it may seem like just a collection of numbers and statistics, the importance of presenting demographic data cannot be understated. Let’s explore why:
1. Understanding the Target Audience: Demographic data allows researchers to gain a deeper understanding of the target audience they are studying. By analyzing the demographics, researchers can identify patterns, trends, and preferences among different segments of the population. This knowledge is invaluable when it comes to tailoring products, services, or marketing campaigns to specific groups of people.
2. Making Informed Decisions: Presenting demographic data enables researchers to make informed decisions based on the characteristics of the population being studied. This information can help guide business strategies, resource allocation, policy-making, and more. By having a clear understanding of the demographics, organizations can align their efforts to better serve their target audience.
3. Identifying Disparities and Inequalities: Demographic data allows researchers to identify any disparities or inequalities that may exist within a population. By analyzing factors such as income, education, or access to resources, researchers can shed light on social and economic disparities. This information can then be used to advocate for change, address systemic issues, and promote inclusivity and equality.
4. Tracking Trends Over Time: By consistently presenting demographic data, researchers can track trends and changes within a population over time. This longitudinal analysis provides valuable insights into societal shifts, evolving needs, and emerging opportunities. It helps organizations stay ahead of the curve and adapt their strategies accordingly.
5. Supporting Evidence-Based Research: The presentation of demographic data adds credibility and validity to research findings. By including demographic information, researchers can ensure that their studies are grounded in real-world populations and can be generalized to larger groups. This enhances the reliability of the research and allows for better comparison and benchmarking.
Methods for Presenting Demographic Data
When conducting research that involves demographic data, it is essential to effectively present the findings in a clear and meaningful way. Here are some methods that can be used to present demographic data:
1. Charts and Graphs: Visual representations, such as bar graphs, pie charts, and line graphs, are excellent ways to showcase demographic data. These visuals provide a quick overview of the information and make it easier for the audience to understand the patterns and trends.
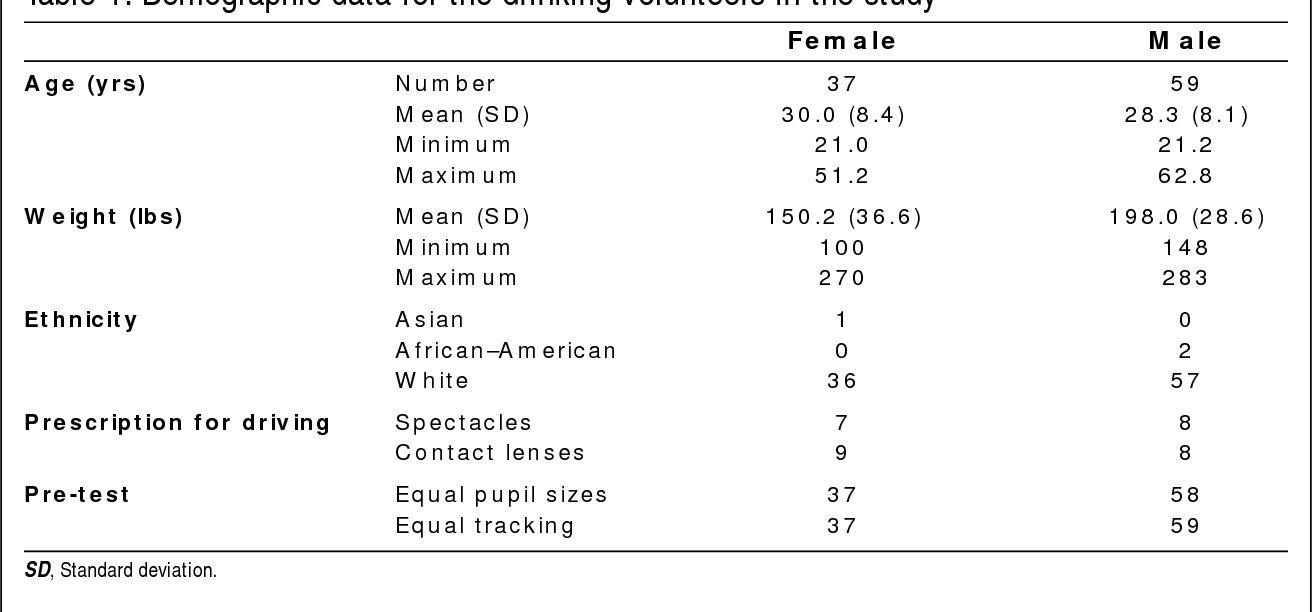
2. Tables: Tables can be a useful method for presenting demographic data, especially when there is a need for detailed information. This format allows for organized presentation of data, making it easier to compare and analyze the different variables.
3. Infographics: Infographics combine text, images, and data visualizations to present complex demographic information in a visually appealing and easily understandable format. Infographics can be particularly effective for capturing the attention of the audience and conveying the key insights.
4. Maps: Maps are valuable tools for presenting demographic data that is geographically based. By plotting the data on a map, it becomes easier to identify regional patterns and disparities. Icons or color-coding can be used to represent different variables, making the information more engaging and accessible.
5. Storytelling: Presenting demographic data in the form of a narrative can be an engaging and compelling way to convey the information. By telling stories that incorporate the data, researchers can create a deeper connection with the audience and make the findings more relatable.
6. Interactive Data Visualization: With advancements in technology, interactive data visualization tools have become increasingly popular. These tools allow the audience to explore the demographic data on their own, interact with different variables, and gain a deeper understanding of the findings.
7. Reports and Summaries: Traditional reports and summaries can still be effective methods for presenting demographic data. By providing a comprehensive overview, highlighting the key findings, and providing contextual information, researchers can ensure that the data is presented in a comprehensive and meaningful way.
Overall, the method chosen for presenting demographic data should align with the research objectives, target audience, and the nature of the data itself. A combination of different methods can be used to create a comprehensive and engaging presentation that effectively communicates the insights derived from the demographic data.
Common Challenges in Presenting Demographic Data
Presenting demographic data in research can be a complex task that comes with its own set of challenges. Researchers often encounter various hurdles when attempting to effectively convey demographic information to their audience. Let’s explore some of the common challenges that researchers face when presenting demographic data:
1. Privacy and Confidentiality Concerns: One of the biggest challenges in presenting demographic data is the need to ensure privacy and confidentiality. Research involving sensitive demographic information, such as race, ethnicity, or income, must be handled with utmost care to protect the participants’ identities and maintain their trust.
2. Data Accuracy and Validity: Ensuring the accuracy and validity of the demographic data is crucial. Researchers must employ rigorous methods to collect and analyze data to avoid any biases or errors. Incorporating measures to validate the demographic information can help strengthen the credibility of the research findings.
3. Data Representation and Visualization: Choosing the right method of representing and visualizing demographic data can be challenging. Researchers need to select appropriate graphs, charts, or tables that effectively convey the information in a clear and understandable manner. It is important to consider the target audience and their level of data literacy when deciding on the best way to present the data.
4. Dealing with Missing Data: In many research studies, there may be instances where demographic data is missing or incomplete. Handling missing data can pose a challenge as it may affect the overall validity and reliability of the research findings. Researchers must implement appropriate strategies, such as imputation techniques, to address missing data and minimize its impact on the study results.
5. Interpreting and Communicating Findings: Interpreting demographic data can be a complex process, especially when analyzing multiple variables or conducting subgroup comparisons. Researchers need to communicate their findings effectively, translating the statistical information into meaningful insights that are easily understandable by a non-technical audience. Clear and concise communication is key to ensuring that the demographic data is accurately interpreted and its implications are conveyed.
6. Cultural Sensitivity: When working with demographic data, cultural sensitivity is of utmost importance. Researchers must be mindful of diverse cultural backgrounds, values, and beliefs that may impact how demographic data is perceived. The proper contextualization and interpretation of demographic data in different cultural contexts can help avoid any unintended misinterpretations or misunderstandings.
7. Ethical Considerations: Lastly, presenting demographic data ethically is essential. Researchers must ensure that the information presented respects the rights and dignity of the individuals involved. Data dissemination should be conducted in a responsible and accountable manner, upholding the principles of research ethics and protecting the integrity of the data.
By acknowledging and addressing these common challenges, researchers can effectively present demographic data in their research, making it more accessible, credible, and valuable to the intended audience.
Overall, effectively presenting demographic data in research is crucial for understanding and analyzing the characteristics of a population. By utilizing various visual tools such as charts, graphs, and maps, researchers can communicate complex information in a clear and concise manner.
When presenting demographic data, it is important to consider the target audience and their level of familiarity with statistical information. Choosing the right type of visualization, providing clear labels and legends, and ensuring the accuracy of the data can greatly enhance the effectiveness of the presentation.
Furthermore, incorporating contextual information and providing meaningful interpretations of the data can help the audience grasp the significance and implications of the findings. By presenting demographic data in a visually appealing and accessible way, researchers can effectively convey their research findings and contribute to a better understanding of the characteristics and trends within a population.
FAQs
1. How important is demographic data in research?
Demographic data plays a crucial role in research as it provides valuable insights into the characteristics of a specific population or target audience. By collecting and analyzing demographic information, researchers can better understand the social, economic, and cultural factors that may influence their research findings.
2. What are some common demographic variables used in research?
Common demographic variables used in research include age, gender, education level, income, ethnicity, and geographic location. These variables help researchers classify and understand different segments of the population under study.
3. How can demographic data be collected for research?
Demographic data can be collected through various methods, including surveys, censuses, interviews, and observation. Researchers can also gather demographic information from existing datasets and secondary sources. It is important to ensure that the data collection methods are reliable, accurate, and respect the privacy and confidentiality of the participants.
4. How can demographic data be presented in research?
Demographic data can be presented in research through various means, such as charts, graphs, tables, and visualizations. These visual representations help to communicate complex information in a clear and concise manner. Additionally, researchers can use descriptive statistics, such as percentages and averages, to summarize and analyze the demographic data.
5. How can demographic data be analyzed in research?
Demographic data can be analyzed using both qualitative and quantitative methods. Qualitative analysis involves interpreting and understanding the patterns, trends, and themes within the demographic data. Quantitative analysis, on the other hand, involves using statistical techniques to analyze and draw conclusions from the data. Researchers can use software programs, such as SPSS or Excel, to aid in the analysis process.