
When working with data analysis or machine learning in R, it is crucial to split your data into training and testing sets. This process allows you to evaluate the performance of your model on unseen data and ensure its generalization. Splitting your data helps in assessing the accuracy and effectiveness of your algorithms or models before deploying them in real-world scenarios. In this article, we will explore the various techniques and functions available in R to split your data into training and testing sets. By understanding these methods, you will be able to perform thorough analysis and build robust models that can make accurate predictions on new observations. So, let’s dive into the world of data splitting in R!
Inside This Article
- What is data splitting?
- The Importance of Data Splitting in Machine Learning
- Methods for Data Splitting in R
- Evaluating the effectiveness of data splitting methods
- Conclusion
- FAQs
What is data splitting?
Data splitting is a crucial step in the field of machine learning. It refers to the process of dividing a dataset into separate subsets for training and testing purposes. The main goal of data splitting is to assess the performance of a machine learning model on unseen data.
During the data splitting process, the original dataset is divided into two or more subsets: a training set and a testing set. The training set is used to train the machine learning model, while the testing set is used to evaluate its performance.
Data splitting is essential because it helps in estimating how well the trained model will generalize to new, unseen data. It allows us to calculate the accuracy or error rate of the model on data that it has not been exposed to during the training phase.
By splitting the data into training and testing sets, we can simulate the model’s performance in real-world scenarios where it encounters new and unfamiliar data. This evaluation helps us understand if the model is overfitting (performing well on the training data but poorly on the test data) or underfitting (performing poorly on both training and test data).
The Importance of Data Splitting in Machine Learning
Data splitting is a crucial step in machine learning, as it plays a vital role in the model’s performance and generalization. When working with a dataset, it is important to divide it into two subsets: a training set and a testing set. The training set is used to train the model, while the testing set is used to evaluate its performance.
The primary reason for data splitting is to assess how well the trained model will perform on unseen data. By testing the model on a separate set of data, we can get an unbiased estimate of its accuracy. This helps us determine whether the model has successfully learned the underlying patterns in the training set or if it is overfitting, which means it has memorized the training data but cannot generalize well to new data.
Data splitting also helps prevent information leakage, which can occur when the same data is used for both training and testing. If the model is evaluated on the same data it was trained on, it will likely produce optimistic results, giving a false sense of its true performance. By using separate datasets for training and testing, we can obtain a more realistic evaluation of the model’s capabilities.
Another benefit of data splitting is the ability to tune and optimize the model’s hyperparameters. Hyperparameters are parameters that are not learned by the model, but rather set manually by the user. These parameters have a significant impact on the model’s performance, and finding the right combination can be challenging. By splitting the data into training and validation sets, we can perform iterative experiments to fine-tune the hyperparameters, ensuring that the model achieves optimal performance.
Data splitting also enables us to estimate the model’s performance on unseen, real-world data. By deploying the trained model to production, we can evaluate how well it performs in real-time scenarios. This not only helps validate the model but also provides insights into its generalizability and potential limitations.
Methods for Data Splitting in R
When working with machine learning models in R, it is crucial to split your data into training and testing sets to assess the model’s performance accurately. Choosing the right method for data splitting is essential for obtaining reliable results. In this section, we will explore some popular methods for data splitting in R.
1. Random Split:
The random split method involves randomly dividing the data into training and testing sets. This method is widely used and suitable for most cases. In R, you can utilize the sample() function to randomly select a subset of the data as the testing set and the remaining as the training set. The proportion of the split can be specified to meet your requirements.
2. Stratified Split:
Stratified splitting is commonly used when dealing with imbalanced datasets, where the distribution of the target variable is uneven. It ensures that the proportion of each class in the original dataset is preserved in both the training and testing sets. In R, you can achieve stratified splitting using the createDataPartition() function from the caret package.
3. Time Series Split:
Time series data requires a specialized approach to splitting. In time series analysis, it is crucial to maintain the temporal order of the data. The time series split method allows you to separate the data based on a specific time point. R provides the window() function, which allows you to define the training and testing periods based on time intervals.
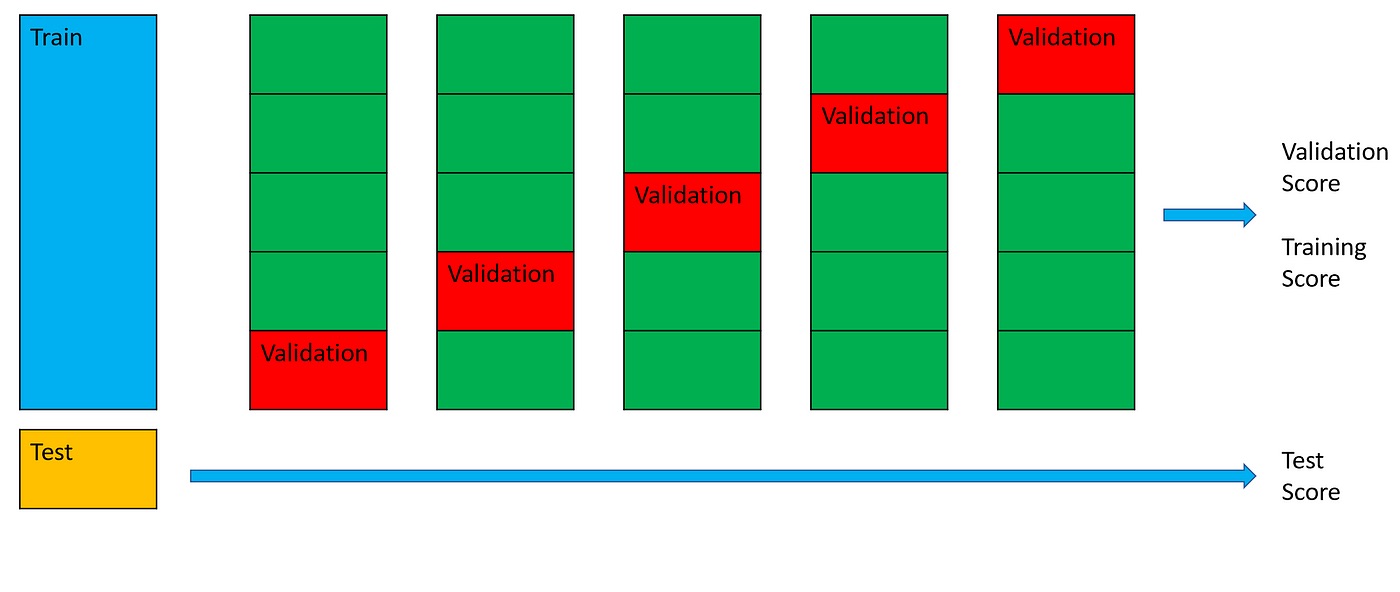
4. Cross-Validation:
Cross-validation is a robust method for evaluating model performance. It involves splitting the data into multiple subsets, known as folds, and iteratively using each fold as the testing set while the remaining folds are used for training. R offers various cross-validation techniques, such as k-fold cross-validation using the cvms() function from the caret package.
Remember, the choice of data splitting method should be based on the characteristics of your dataset and the goals of your analysis. It is recommended to experiment with different splitting techniques to find the most suitable one for your specific use case.
Evaluating the effectiveness of data splitting methods
When working with machine learning algorithms, it is essential to evaluate the effectiveness of different data splitting methods. Proper evaluation allows us to assess the performance of a model accurately and make informed decisions. In this section, we will explore some of the key factors to consider when evaluating the effectiveness of data splitting methods in R.
1. Model Performance: One of the primary factors to consider is the performance of the machine learning model using the training and testing data sets. The performance metrics, such as accuracy, precision, recall, and F1 score, can provide valuable insights into how well the model performs on the test data. Comparing the performance across different data splitting methods can help identify the most effective one.
2. Generalization Ability: The ability of a model to perform well on unseen data is crucial for its effectiveness. Evaluating the generalization ability of the model using cross-validation techniques, such as k-fold cross-validation, can help determine if the data splitting method is producing consistently good results across multiple iterations.
3. Bias and Variance: Data splitting methods can affect the bias-variance trade-off in machine learning models. A good data splitting method should strike a balance between underfitting (high bias) and overfitting (high variance). By evaluating the bias and variance of the model’s performance across different data splitting methods, we can choose the one that achieves the optimal balance.
4. Consistency: Consistency is vital when evaluating the effectiveness of data splitting methods. Ideally, a reliable data splitting method should produce consistent results across different runs. This consistency ensures that the performance metrics are reliable and not overly influenced by random chance.
5. Robustness: Robustness refers to the ability of a data splitting method to handle variations in the dataset. It should perform well even when the dataset has imbalanced classes, outliers, missing values, or other challenges. Evaluating the performance of a model using different variations of the dataset can help determine the robustness of the data splitting method.
6. Computational Efficiency: Another factor to consider is the computational efficiency of the data splitting method. In machine learning, larger datasets can significantly impact training time. Evaluating how efficiently a data splitting method divides the dataset without sacrificing the performance of the model can help choose the most efficient option.
7. Comparison with Baseline: Lastly, comparing the effectiveness of different data splitting methods with a baseline can provide valuable insights. A baseline can be a random data splitting method or a predefined splitting strategy. By comparing the performance metrics of different methods against the baseline, we can assess any improvements or drawbacks.
Overall, evaluating the effectiveness of data splitting methods in R involves considering various factors, such as model performance, generalization ability, bias and variance, consistency, robustness, computational efficiency, and comparison with a baseline. By carefully assessing these factors, we can select the most suitable data splitting method for our machine learning tasks.
The process of splitting data into training and testing sets is a critical step in machine learning and data analysis tasks in R. By separating the data into two distinct sets, we can effectively evaluate the performance of our models and ensure their generalizability to new, unseen data.
In this article, we have explored different methods for splitting data, such as random sampling and stratified sampling. We have also discussed the importance of maintaining the proportion of class labels in the training and testing sets when dealing with imbalanced datasets.
Furthermore, we have demonstrated how the caret package in R provides convenient functions to automatically split the data, taking into account the desired ratios and any specific requirements. This can save time and effort, especially when working with large datasets.
By correctly splitting our data, we can train and evaluate our models accurately, leading to more robust and reliable results. It is crucial to experiment with different splitting techniques and evaluate the performance of our models on the testing set to ensure the effectiveness of our data analysis workflows.
FAQs
1. Why is it important to split data into training and testing sets in R?
Splitting data into training and testing sets is crucial in order to assess the performance and generalization of a machine learning model. By training the model on a portion of the data and evaluating its performance on a separate testing set, we can estimate how well the model will perform on unseen data. This helps in avoiding overfitting, where the model becomes too specific to the training data and fails to generalize well to new data.
2. How can I split data into training and testing sets in R?
In R, we can use various methods to split data into training and testing sets. One commonly used approach is the holdout method, where we randomly split the data into a training set (usually 70-80% of the data) and a testing set (usually 20-30% of the data). The `createDataPartition` function from the caret package is often used to perform this split, ensuring that the classes are represented proportionally in both sets.
3. What is cross-validation, and how does it differ from a simple train-test split?
Cross-validation is a technique used to assess the performance of a model by splitting the data into multiple subsets, performing multiple train-test splits, and averaging the results. It helps in obtaining a more robust evaluation of the model by reducing the impact of random variations in the train-test split. Unlike a simple train-test split, cross-validation provides a more accurate estimate of a model’s performance.
4. Can I customize the ratio of training and testing data in R?
Yes, in R, you can customize the ratio of training and testing data according to your specific needs. Instead of using the default ratios, you can specify the desired proportions using the `train_test_split` function from the caret package. For example, if you want a 60-40 split, you can set the `test_size` parameter to 0.4.
5. How can I ensure reproducibility when splitting data in R?
To ensure reproducibility when splitting data in R, you can set a random seed before performing the split. By setting a random seed using the `set.seed` function, you can ensure that the data split will be the same every time you run the code. This is important when you want to compare the performance of different models or share your code with others.