
Google Forms is a powerful tool that allows you to create online forms and collect data efficiently. Whether you’re conducting surveys, organizing events, or gathering feedback, Google Forms provides a user-friendly interface to collect and analyze data. However, the real challenge lies in effectively analyzing the data you collect through Google Forms to derive meaningful insights and make informed decisions.
In this article, we will explore how to analyze Google Form data and extract valuable information from the responses. We will walk you through various techniques and strategies to make the most of the data you collect through Google Forms. From visualizing data through charts and graphs to conducting statistical analysis, we will dive into the steps and tools you need to analyze your data effectively. So, let’s get started and unlock the power of your Google Form data!
Inside This Article
- Overview
- Step 1: Exporting Google Form Responses
- Step 2: Cleaning and Preparing the Data
- Step 3: Analyzing Multiple Choice Questions
- Step 4: Analyzing Text Responses
- Step 5: Visualizing the Data
- Step 6: Generating Insights and Recommendations
- Conclusion
- FAQs
Overview
Google Forms is a powerful tool that allows you to create custom surveys and collect data from respondents. Once you’ve gathered the responses, it’s essential to analyze the data to gain valuable insights. This article will guide you through the process of analyzing Google Form data, from exporting the responses to visualizing the data and generating meaningful recommendations.
By analyzing the data collected from Google Forms, you can discover patterns, trends, and correlations that can inform decision-making, improve processes, or guide your marketing strategies. Whether you’re a researcher, marketer, educator, or simply looking to gain insights from your survey results, this guide will provide you with the necessary steps to effectively analyze your Google Form data.
With the step-by-step instructions outlined in this article, you’ll learn how to export the form responses, clean and prepare the data, analyze multiple-choice questions, analyze text responses, visualize the data, and ultimately, generate insights and recommendations.
Whether you’re working with a small sample size or large-scale data, this guide will equip you with the skills to make sense of your Google Form data and leverage it to make informed decisions. Let’s dive in and discover the various steps involved in analyzing Google Forms data!
Step 1: Exporting Google Form Responses
Exporting the responses from your Google Form is the first step in analyzing the data collected. By exporting the data, you can manipulate and analyze it in various ways to gain valuable insights.
To export the responses, follow these steps:
- Navigate to the Google Form for which you want to export the responses.
- Click on the “Responses” tab at the top of the form.
- Click on the green “Google Sheets” icon to create a new spreadsheet linked to your form.
- A new spreadsheet will open with all the form responses automatically populated in it. Each response will be displayed in a new row.
- To keep your data organized and easily accessible, consider renaming the spreadsheet and creating separate sheets for different sections of the form.
- Now that you have successfully exported the form responses, you can proceed to the next step of cleaning and preparing the data for analysis.
Remember to save your spreadsheet and make regular backups to avoid any data loss.
Step 2: Cleaning and Preparing the Data
Once you have exported the Google Form responses, the next crucial step in analyzing the data is cleaning and preparing it. Raw data often contains discrepancies, missing values, and other inconsistencies that can affect the accuracy and reliability of your analysis. In this step, we will walk you through the process of cleaning and preparing the data to ensure that it is ready for analysis.
The first task in cleaning the data is to check for any missing values. Missing values can occur when a respondent skips a question or leaves it unanswered. These missing values can affect the integrity of your analysis, so it’s important to identify and address them. Most data analysis tools provide functions to detect missing values and either delete, impute, or handle them in a way that aligns with your analysis goals.
Next, you should ensure that the data is properly formatted. This includes checking for any formatting inconsistencies, such as variations in date formats or inconsistent capitalization. Standardizing the formatting of the data will not only make it easier to work with but also prevent any inconsistencies from affecting your analysis.
Another important aspect of data cleaning is removing any duplicate entries. Duplicate entries can arise from various sources, such as accidental double submissions or data entry errors. Identifying and removing these duplicates will help ensure the accuracy and reliability of your analysis.
It is also advisable to perform data validation and outlier detection during the cleaning process. Data validation involves checking for any erroneous or implausible values that may have been entered mistakenly. Outlier detection helps identify extreme or unusual data points that may significantly impact the overall analysis. Both of these steps help ensure the quality and credibility of your analysis.
Finally, consider transforming the data to make it more suitable for analysis. This may involve creating new variables, aggregating data, or applying mathematical functions. Data transformation can help uncover patterns and relationships that may not be apparent in the raw form of the data.
By thoroughly cleaning and preparing the data, you can ensure that your subsequent analysis provides accurate and meaningful insights. Taking the time to address inconsistencies and prepare your data will lay a solid foundation for extracting valuable information and making informed decisions based on the analysis.
Step 3: Analyzing Multiple Choice Questions
Once you have exported and cleaned the data from your Google Form responses, it’s time to dive into analyzing the multiple choice questions. This step is crucial as it allows you to gain insights into the preferences, opinions, and trends among your respondents.
In this step, you will need to identify the different response options for each multiple choice question. Begin by reviewing the data and taking note of the various choices provided for each question. It’s important to determine the number of respondents who selected each option to understand the distribution of responses.
One approach to analyzing multiple choice questions is to create a frequency distribution. This involves tallying the number of times each option was chosen and organizing the data into a table or graph. By visualizing the distribution, you can quickly identify any popular or less popular choices.
Another aspect to consider when analyzing multiple choice questions is the demographics of your respondents. You may want to explore differences in responses based on age, gender, or other relevant factors. By segmenting the data, you can gain valuable insights into specific target groups and tailor your analysis accordingly.
Additionally, it can be helpful to calculate the percentages for each response option. This allows you to see the proportion of respondents who selected each choice relative to the total number of responses. Percentages provide a clearer understanding of the distribution and help identify any patterns or trends.
As you analyze the multiple choice questions, make sure to pay attention to any unexpected or outlier responses. These may indicate interesting insights or potential areas for further exploration. It’s important to dig deeper into such responses to understand the underlying reasons behind them.
To enhance your analysis, consider cross-referencing the multiple choice questions with other questions in the survey. This can provide deeper insights into the relationships between different variables and help you uncover interesting connections.
Finally, as you analyze the multiple choice questions, keep in mind the overall goal of your survey and the specific objectives you set out to achieve. By aligning your analysis with these goals, you can extract meaningful insights that can inform decision-making and drive improvements in your organization or project.
Step 4: Analyzing Text Responses
Once you have exported and cleaned your Google Form responses, you can start analyzing the text-based answers provided by your participants. This step is crucial as it allows you to gain deeper insights into the thoughts, opinions, and experiences expressed in the open-ended questions.
Here are a few key techniques you can use to effectively analyze text responses:
1. Keyword Analysis: One of the easiest ways to analyze text responses is by identifying the most frequently used keywords. By identifying these keywords, you can gain an understanding of the main themes and topics that are being discussed by your respondents. Look for recurring words or phrases that provide valuable insights into the opinions and sentiments expressed in the text.
2. Sentiment Analysis: Sentiment analysis is a powerful technique that allows you to determine the emotional tone of the text responses. By using natural language processing algorithms, you can categorize the responses into positive, negative, or neutral sentiment. This provides a quantitative measure of the overall sentiment expressed by your respondents, helping you identify common sentiments or patterns.
3. Thematic Analysis: Thematic analysis involves identifying recurring themes or patterns within the text responses. This approach helps you uncover the underlying concepts or ideas discussed by your participants. Start by reading through the responses and labeling each one with a specific theme or category. This enables you to identify the most prominent themes and understand the overall focus of the responses.
4. Content Analysis: Content analysis involves systematically coding and categorizing the text responses based on predefined categories or codes. This approach allows you to quantify and analyze specific aspects of the responses, such as identifying common issues, suggestions, or recommendations. By coding the responses, you can generate numerical data that can be further analyzed and compared.
5. Word Clouds: Word clouds are visual representations of the most frequently used words in the text responses. These visualizations provide a quick and intuitive way to identify the most common themes or concepts that emerge from the responses. By creating word clouds, you can easily spot the prominent keywords and gain a visual overview of the main topics discussed.
By utilizing these techniques, you can gain valuable insights from the text responses collected through your Google Form. Remember to take notes, highlight important findings, and compare the results across different questions to identify trends or patterns in the data.
Step 5: Visualizing the Data
Visualizing the data from your Google Form responses is a crucial step in gaining meaningful insights and presenting them in a clear and compelling manner. By transforming your data into visual representations such as charts, graphs, and diagrams, you can easily identify patterns, trends, and relationships that may not be immediately apparent when looking at raw data.
There are several powerful tools available that can help you visualize your Google Form data. One of the most popular options is Google Sheets, which offers a wide range of customizable charts and graphs. To get started, open your Google Form responses in Google Sheets by exporting the data as a .csv or .xlsx file and importing it into a new or existing sheet.
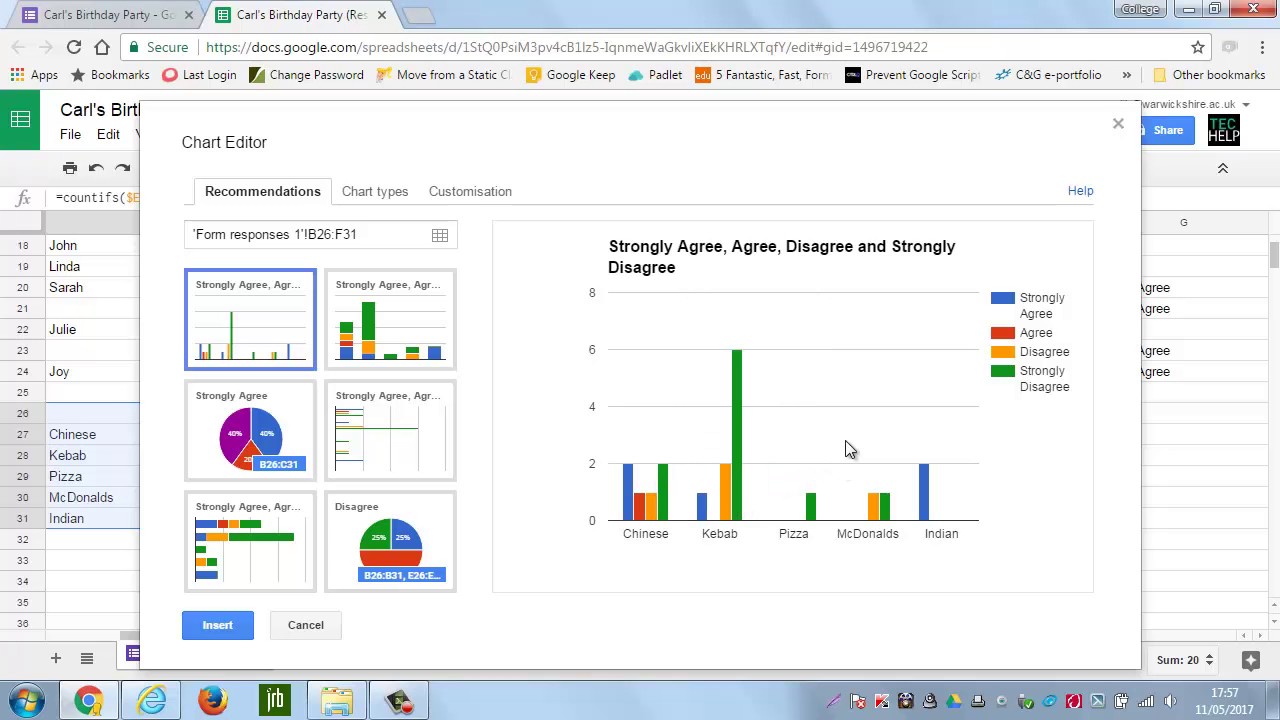
Once you have your data in Google Sheets, you can explore the various chart options by clicking on the “Insert” menu and selecting “Chart”. From there, you can choose the chart type that best represents your data, such as bar charts, pie charts, line graphs, or scatter plots. Google Sheets also allows you to customize the appearance of your charts, including colors, labels, and axes.
If you are looking for more advanced visualization options, you can consider using data visualization tools like Tableau or Microsoft Power BI. These tools offer a wide range of features and functionalities to create dynamic and interactive visualizations. You can connect your Google Form data directly to these tools and explore different visualization options to gain deeper insights.
When visualizing your data, it’s important to consider the purpose of your analysis and the audience you are presenting to. Choose the visualization type that effectively communicates the key findings and insights from your data. Use labels, titles, and legends to provide context and make it easy for your audience to understand the information being presented.
In addition to static charts and graphs, you can also consider using interactive visualizations to allow your audience to explore the data themselves. This can be done using tools like Tableau Public or Google Data Studio, where you can create interactive dashboards and reports that enable users to filter, drill down, and manipulate the data to gain a deeper understanding.
Remember, visuals have the power to make complex data more accessible and engaging. By effectively visualizing your Google Form data, you can uncover valuable insights and effectively communicate your findings to your audience.
Step 6: Generating Insights and Recommendations
After completing the data analysis process, it’s time to generate insights and recommendations based on the findings. This step plays a crucial role in translating the raw data into actionable insights that can drive decision-making and improve business outcomes. Here are some key considerations for generating meaningful insights and recommendations:
1. Identify patterns and trends: Look for recurring themes, patterns, and trends in the data. This could involve analyzing common responses, identifying outliers, and observing any correlations or relationships between different variables. By understanding the patterns, you can gain valuable insights into user preferences, behaviors, or issues that need addressing.
2. Segment your data: Break down your data into different segments to uncover insights specific to certain demographics, user groups, or customer segments. This segmentation can provide deeper insights into the needs, preferences, and behaviors of different subsets of your audience.
3. Compare results to benchmarks: Compare your data to industry benchmarks, internal targets, or past performance to assess how well you’re doing. This comparison can help identify areas of improvement or highlight successes that can be replicated or scaled up.
4. Use data visualization techniques: Visualize your data using charts, graphs, or infographics to present your findings in a more digestible and engaging format. By visualizing the data, you can effectively communicate your insights and create a compelling story around the data.
5. Prioritize actionable recommendations: Based on your insights, prioritize recommendations that are practical, achievable, and can have a significant impact. These recommendations should address the challenges or leverage the opportunities identified through the data analysis.
6. Communicate your findings: Ensure that your insights and recommendations are communicated clearly and effectively to relevant stakeholders. Use concise, jargon-free language and provide supporting evidence to back up your recommendations and build trust in the data-driven decision-making process.
Remember, the goal of generating insights and recommendations is to empower decision-makers with valuable information that can drive meaningful change. By following these steps and presenting your findings effectively, you can make a strong impact and contribute to the success of your organization.
Conclusion
Analyzing Google Form data is a crucial step in gaining meaningful insights and making informed decisions. By following the steps outlined in this article, you can efficiently collect, organize, and analyze the data gathered from your Google Forms. Remember to keep your goals and objectives in mind when designing your form and selecting the appropriate data analysis tools. Whether you’re conducting surveys, feedback forms, or event registrations, the data captured in Google Forms can provide valuable information for improving processes, understanding customer needs, and making data-driven decisions. So, dive into the data and uncover the insights that can drive your success.
FAQs
1. Why is it important to analyze Google Form data?
Analyzing Google Form data allows you to gain valuable insights and make informed decisions. It helps you understand trends, patterns, and preferences among your audience or respondents. This analysis can aid in improving products, services, or processes, making data-driven decisions, and identifying areas for growth.
2. What are some useful tools for analyzing Google Form data?
There are several tools you can use to analyze Google Form data, depending on your needs and preferences. Google Sheets is a popular choice as it allows you to import and manipulate the data easily. Other options include data visualization tools like Tableau or Power BI, which can help you create interactive dashboards and visual representations of the data.
3. How can I analyze multiple-choice questions in Google Forms?
To analyze multiple-choice questions in Google Forms, you can use the built-in Summary of responses feature. This feature provides an overview of the responses, including the number and percentage of respondents who selected each option. You can also export the responses to Google Sheets for further analysis using formulas or pivot tables.
4. What methods can I use to analyze open-ended questions in Google Forms?
Analyzing open-ended questions in Google Forms can be more challenging since the responses are text-based. However, you can use techniques such as sentiment analysis or keyword extraction to gain insights from the data. Text analysis tools like RapidMiner or Python libraries like NLTK can assist in performing these types of analyses.
5. How can I track and analyze trends over time in Google Forms?
To track and analyze trends over time in Google Forms, you can create a new form for each time period or use a timestamp or date question type in your form. By collecting data over multiple iterations, you can compare and analyze the results to identify any changes or patterns that may have occurred over time.