
Are you looking for a quick and efficient way to rearrange your data? Transposing data can be incredibly useful when you want to switch the orientation of your dataset from rows to columns or vice versa. Whether you’re working with spreadsheets, databases, or any other form of data, transposing can streamline your analysis and make it easier to interpret the information. In this article, we will explore the concept of data transposition and provide you with step-by-step instructions on how to transpose data effectively. So, if you’re ready to take your data manipulation skills to the next level, let’s dive in and learn how to transpose data with ease!
Inside This Article
- Overview
- Step 1: Understanding Transposition
- Step 2: Transposing Data in Microsoft Excel
- Step 3: Transposing Data in Google Sheets
- Step 4: Transposing Data in R Programming
- Conclusion
- FAQs
Overview
Transposing data is a useful technique when you need to reorganize and manipulate data in a spreadsheet or programming language. It involves converting rows into columns and vice versa, which can be helpful for data analysis, creating reports, or simplifying complex datasets.
In this article, we will explore how to transpose data using different tools such as Microsoft Excel, Google Sheets, and R programming. Whether you are a spreadsheet enthusiast or a data scientist, understanding the process of transposing data will provide you with the flexibility to work with your datasets more effectively.
Transposing data allows you to rearrange the information to suit your needs, making it easier to analyze trends, compare values, or present data in a more visually appealing way. It gives you the power to reshape your data and gain new insights.
Let’s dive into the step-by-step instructions on how to transpose data using popular tools and languages.
Step 1: Understanding Transposition
Transposition is the process of rearranging or reorganizing data from vertical orientation to horizontal orientation, or vice versa. It is a commonly used technique in data analysis, spreadsheet management, and programming. Understanding how transposition works is crucial for manipulating and presenting data in a more meaningful way.
When data is transposed, the rows become columns and the columns become rows. This allows for a different perspective on the data, making it easier to analyze and compare information. Transposition is particularly useful for transforming data that is not in the desired format or for creating summaries and reports.
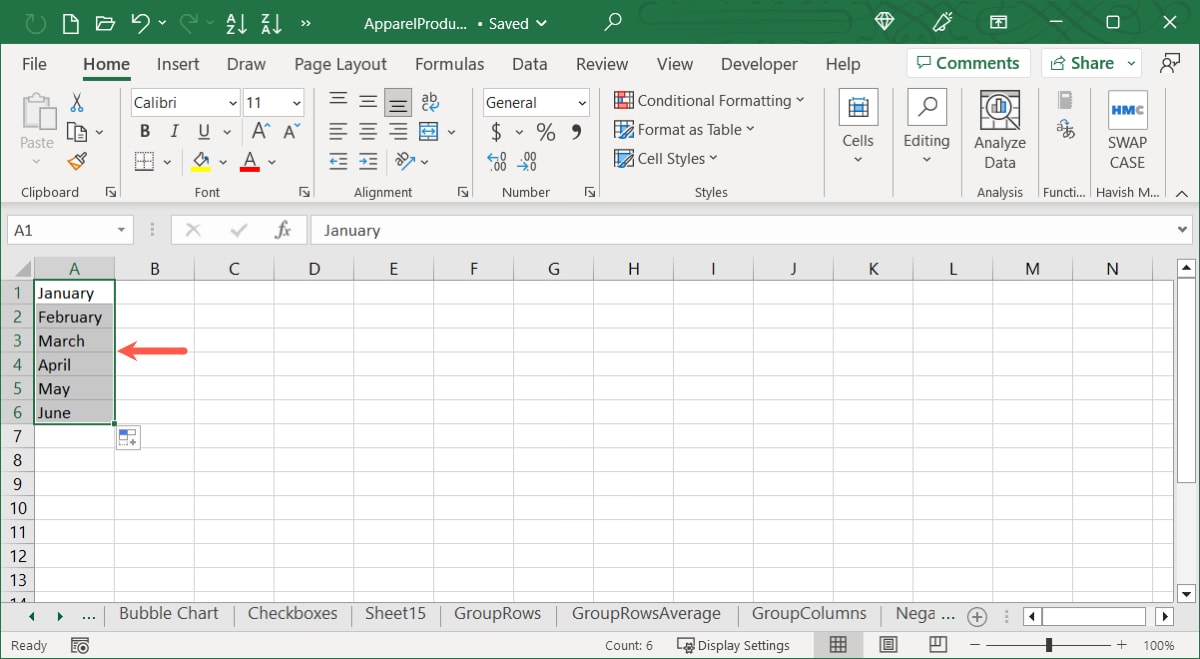
By transposing data, you can consolidate information and make it more accessible. For example, if you have a spreadsheet with data organized by month in rows and different products in columns, transposing the data would rearrange it so that each product is listed in rows and the months are now columns. This makes it easier to analyze sales by product over time.
In addition to arranging data for analysis purposes, transposition can also be used for data entry convenience. For instance, if you have data presented in a vertical format and you need to enter it into a system that requires horizontal input, transposing the data can save you time and effort.
It is important to note that transposing data should be done carefully to avoid losing any important information or causing data inconsistencies. Always create a backup of your data before performing any transposition to ensure you can revert to the original format if needed.
Step 2: Transposing Data in Microsoft Excel
Microsoft Excel is a powerful spreadsheet tool that allows users to perform various data manipulation tasks, including transposing data. Transposing data in Excel means converting rows into columns or vice versa, which can be helpful when dealing with datasets that are not in the desired format.
To transpose data in Microsoft Excel, follow these simple steps:
- Open Microsoft Excel and open the worksheet containing the data you want to transpose.
- Select the range of cells that you want to transpose. This range can include both the row headers and the data you want to transpose.
- Right-click on the selected range and choose “Copy.”
- Select a new location in your worksheet where you want to paste the transposed data.
- Right-click on the cell where you want to begin pasting, and then select “Paste Special.”
- In the “Paste Special” dialog box, check the “Transpose” option under the “Paste” section.
- Click on the “OK” button to transpose the data in Excel.
Once you click “OK,” Excel will transpose the selected data, switching the rows and columns. This can be particularly useful when you want to rearrange your data for analysis, create PivotTables, or generate charts.
It’s worth noting that transposing data in Excel is a non-destructive process, meaning that it does not delete or overwrite the original data. The transposed data will be pasted as a separate set of values in the desired location.
This simple process can save you a lot of time and effort when dealing with datasets that need to be rearranged. By transposing data in Microsoft Excel, you can quickly transform your spreadsheet into a more manageable format for further analysis and visualization.
Step 3: Transposing Data in Google Sheets
Google Sheets is a powerful and user-friendly tool that allows you to manipulate and analyze data easily. Transposing data in Google Sheets is a straightforward process that can be done with just a few simple steps. Whether you want to rearrange rows into columns or vice versa, Google Sheets provides a built-in feature for transposing data.
Here’s how you can transpose data in Google Sheets:
- Open your Google Sheets document and locate the data that you want to transpose.
- Select the range of cells that contain the data you want to transpose. You can either click and drag your cursor to select the range, or you can hold down the Shift key and use the arrow keys to highlight the range.
- Right-click on the selected range of cells, and a context menu will appear. In the context menu, click on “Copy” to copy the selected data.
- Next, right-click on an empty cell where you want the transposed data to be placed. In the context menu, click on “Paste special” and then select “Paste transpose.”
- Once you click on “Paste transpose,” the data will be transposed, with the rows becoming columns and the columns becoming rows.
- Review the transposed data to ensure it has been rearranged correctly. You can make further adjustments or formatting changes as needed.
Google Sheets also offers additional options for transposing data, such as using formulas. For more advanced transposition and data manipulation tasks, you can explore the various formulas and functions available in Google Sheets.
Transposing data in Google Sheets can be extremely useful in various scenarios. For example, if you have survey data where each row represents a respondent and each column represents a question, transposing the data can help you analyze the responses for each question more easily.
By following these simple steps, you can efficiently transpose data in Google Sheets and unlock new possibilities for data analysis and presentation. Experiment with different data sets and explore the extensive features of Google Sheets to make the most of your data.
Step 4: Transposing Data in R Programming
In the world of data analysis and statistics, R programming has become a popular choice among professionals and researchers. This powerful programming language offers a wide range of functions and packages for data manipulation, including the ability to transpose data.
Transposing data in R programming means converting rows into columns and columns into rows. This can be particularly useful when you want to change the orientation of your data or when you need to reformat it for specific analyses or visualizations.
To transpose data in R, you can use the built-in function t(). This function takes a matrix or a data frame as input and returns the transposed version of the data.
Here’s an example of how to transpose data using R:
- First, you need to create a matrix or a data frame containing your data. You can do this by using the
matrix()ordata.frame()functions. - Next, you can use the
t()function to transpose the data. Simply pass your data object as an argument to the function. - The transposed data will be returned as a new matrix or data frame.
- You can then assign the transposed data to a new variable if needed.
Here’s a code snippet demonstrating the process:
r
# Create a matrix
data <- matrix(1:6, nrow = 2)
# Transpose the data
transposed_data <- t(data)
# Print the transposed data
print(transposed_data)
Output:
[,1] [,2]
[1,] 1 3
[2,] 2 4
[3,] 3 5
In the example above, we create a matrix with 2 rows and 3 columns using the matrix() function. We then use the t() function to transpose the data, and assign the transposed data to the variable transposed_data. Finally, we print the transposed data using the print() function.
It’s important to note that the t() function can only be used with matrices or data frames. If you have a different type of data structure, you may need to convert it to a matrix or data frame before transposing it.
Transposing data in R programming can be a powerful tool in your data analysis toolbox. By changing the orientation of your data, you can gain new insights and simplify further analyses. So, don’t hesitate to explore the transposition capabilities of R programming for your data manipulation needs.
Conclusion
In conclusion, transposing data is a powerful technique that allows you to rearrange and reorganize information in a more meaningful and efficient way. Whether you are working with spreadsheets, databases, or any other data sources, knowing how to transpose data can be a valuable skill. By using the appropriate methods and tools, you can easily convert rows into columns, and vice versa, to gain insights and facilitate data analysis.
Remember, transposing data involves relatively simple steps, such as selecting the data range, copying it, choosing the transposed paste option, and applying the changes. Additionally, using Excel functions or specialized software can further streamline the process and save you valuable time.
Mastering the art of transposing data will enable you to manipulate and visualize information in a way that best serves your needs, helping you make informed decisions and uncover patterns that may have otherwise gone unnoticed. So, whether you’re a data analyst, business professional, or simply someone looking to better manage their data, understanding how to transpose data can be a game-changer in your data manipulation toolkit.
FAQs
1. What is data transposition?
Data transposition is the process of reorganizing data from its original format into a new format. This involves rotating rows and columns, often to make the data more accessible or to analyze it from a different perspective.
2. Why would I need to transpose data?
There are several reasons why you might need to transpose data. One common reason is when you have data organized in rows, but you need it in columns (or vice versa). Transposing data can also be useful when you want to analyze or present the data in a different orientation.
3. How can I transpose data in Excel?
To transpose data in Excel, you can use the “Paste Special” feature. First, copy the data that you want to transpose. Then, right-click on the cell where you want to paste the transposed data and choose “Paste Special.” In the dialog box that appears, check the “Transpose” option and click “OK.” The data will be transposed and pasted in the new location.
4. Is there a way to transpose data in Python?
Yes, Python provides several libraries and functions for data manipulation, including Pandas. With Pandas, you can easily transpose a DataFrame using the `.transpose()` method or the `.T` attribute. Additionally, libraries like NumPy and SciPy also offer functions for transposing arrays and matrices.
5. Are there any challenges or considerations when transposing data?
When transposing data, it’s important to consider the potential loss of information. Transposing can change the way the data is structured, which may affect the interpretation or analysis of the information. Additionally, transposing large datasets can sometimes lead to performance issues or memory constraints.