
Forecasting sales is a crucial aspect of business planning and decision-making. By accurately predicting future sales based on historical data, businesses can better allocate resources, set targets, and make informed strategic decisions. Excel, with its powerful data analysis and forecasting capabilities, provides a convenient and accessible tool for this task.
In this article, we will explore how to forecast sales in Excel based on historical data. Whether you’re a business owner, sales manager, or analyst, understanding how to utilize Excel for sales forecasting can greatly benefit your organization. We will dive into the steps involved in creating a sales forecast, including data preparation, selecting the appropriate forecasting model, and evaluating the accuracy of the forecast. By the end, you will have a solid understanding of how to leverage Excel’s capabilities to make reliable and insightful sales predictions.
Inside This Article
- Understanding Historical Data
- Gathering and Organizing Data
- Using Excel Functions for Forecasting
- Creating a Line Graph
- Applying Regression Analysis
- Interpreting the Forecasted Sales Data
- Conclusion
- FAQs
Understanding Historical Data
When it comes to forecasting sales in Excel, understanding historical data is crucial. Historical data refers to past sales figures and other relevant metrics that can provide insights into trends, patterns, and seasonality in your business. By analyzing historical data, you can make informed predictions about future sales and plan your business strategies accordingly.
Historical data helps you identify key factors that impact sales, such as seasonal fluctuations, market trends, and consumer behavior. It allows you to analyze the performance of your products or services over a specific time period, helping you spot any patterns or anomalies that may influence future sales.
One of the primary ways to understand historical data is by examining sales trends. By analyzing the data over different time intervals—such as monthly, quarterly, or yearly—you can identify recurring patterns and seasonal trends. For example, if you have a retail business, you may notice that sales are typically higher during the holiday season or weekends.
Another aspect of historical data analysis is recognizing any significant events or factors that may have influenced sales. These can be external factors like economic downturns, product launches, marketing campaigns, or changes in consumer preferences. By identifying these events and their impact on sales, you can account for them when forecasting future sales.
Gathering and organizing historical data is essential for accurate forecasting. This involves collecting data from various sources, such as sales records, customer databases, industry reports, and market research. To ensure consistency and accuracy, it’s important to record and organize the data in a structured manner.
Once you have gathered and organized your historical data, you can begin using Excel functions and tools to perform forecasting. Excel offers a variety of functions, such as AVERAGE, SUM, TREND, and FORECAST, which can help you analyze and predict future sales based on the historical data at hand.
Overall, understanding historical data is the foundation for effective sales forecasting in Excel. By analyzing past trends, identifying key factors, and organizing your data, you can make data-driven predictions about future sales and make informed business decisions. The next step is to gather and organize your data, which we will discuss in the next section.
Gathering and Organizing Data
When it comes to forecasting sales in Excel based on historical data, the first step is to gather and organize the necessary data. This is a crucial step as it lays the foundation for accurate and reliable forecasts.
Start by gathering all the relevant sales data, including the date, units sold, and any other relevant variables, such as the price or marketing efforts during that period. Ensure that the data you collect is complete and covers a significant timeframe to provide a comprehensive view of sales patterns over time.
Once you have collected the data, it’s time to organize it in Excel for ease of analysis. You can create a new sheet within your Excel workbook specifically dedicated to data organization. Here, you can input all the gathered data into columns, assigning each data point to a specific row based on the corresponding date. This will allow you to easily access and manipulate the data.
It’s important to ensure that your data is structured properly. Label each column with clear and descriptive headers, such as “Date,” “Units Sold,” and “Price.” This will make it easier to reference and work with the data in subsequent steps.
As you gather and organize the data, it’s essential to remain consistent and meticulous. Make sure there are no missing or duplicate entries, as these can skew the accuracy of your sales forecasts. If you do encounter any inconsistencies or errors, take the time to correct them before proceeding.
Lastly, consider the frequency at which you want to analyze and forecast the data. Depending on your specific needs, you may choose to analyze the data monthly, quarterly, or annually. This will determine the granularity of your forecasts and impact the level of detail in your analysis.
By gathering and organizing your data effectively, you establish a solid framework for forecasting sales in Excel. With a comprehensive understanding of your historical sales patterns, you can move on to using Excel functions and techniques to further analyze and forecast future sales trends.
Using Excel Functions for Forecasting
Excel offers several powerful functions that can be used to forecast sales based on historical data. These functions can help businesses make informed decisions and plan for the future. In this section, we will explore some of the key Excel functions that can be utilized for forecasting sales.
1. AVERAGE Function: The AVERAGE function calculates the average of a range of values. By using this function with historical sales data, businesses can determine the average sales over a specific period. This can serve as a starting point for forecasting future sales.
2. TREND Function: The TREND function allows businesses to project future sales based on the historical data trend. It estimates a linear trend line that best fits the sales data and extends it into the future. By using the TREND function, businesses can obtain a forecast of future sales.
3. GROWTH Function: The GROWTH function is useful when sales data follows an exponential growth pattern. This function uses the least squares method to calculate an exponential growth curve based on historical data. By applying the GROWTH function, businesses can forecast sales that are likely to follow an exponential growth pattern.
4. FORECAST Function: The FORECAST function is specifically designed for forecasting sales based on historical data. It calculates future sales by using linear regression analysis. By providing the known y-values (historical sales) and x-values (time periods), businesses can obtain a forecast of sales for a future period.
By using these Excel functions, businesses can gain valuable insights into their sales trends and make confident forecasts for the future. It is important to note that these functions provide an estimate and are not guarantees of actual sales figures. Therefore, it is essential to consider other factors that may impact sales, such as market trends, customer behavior, and external influences.
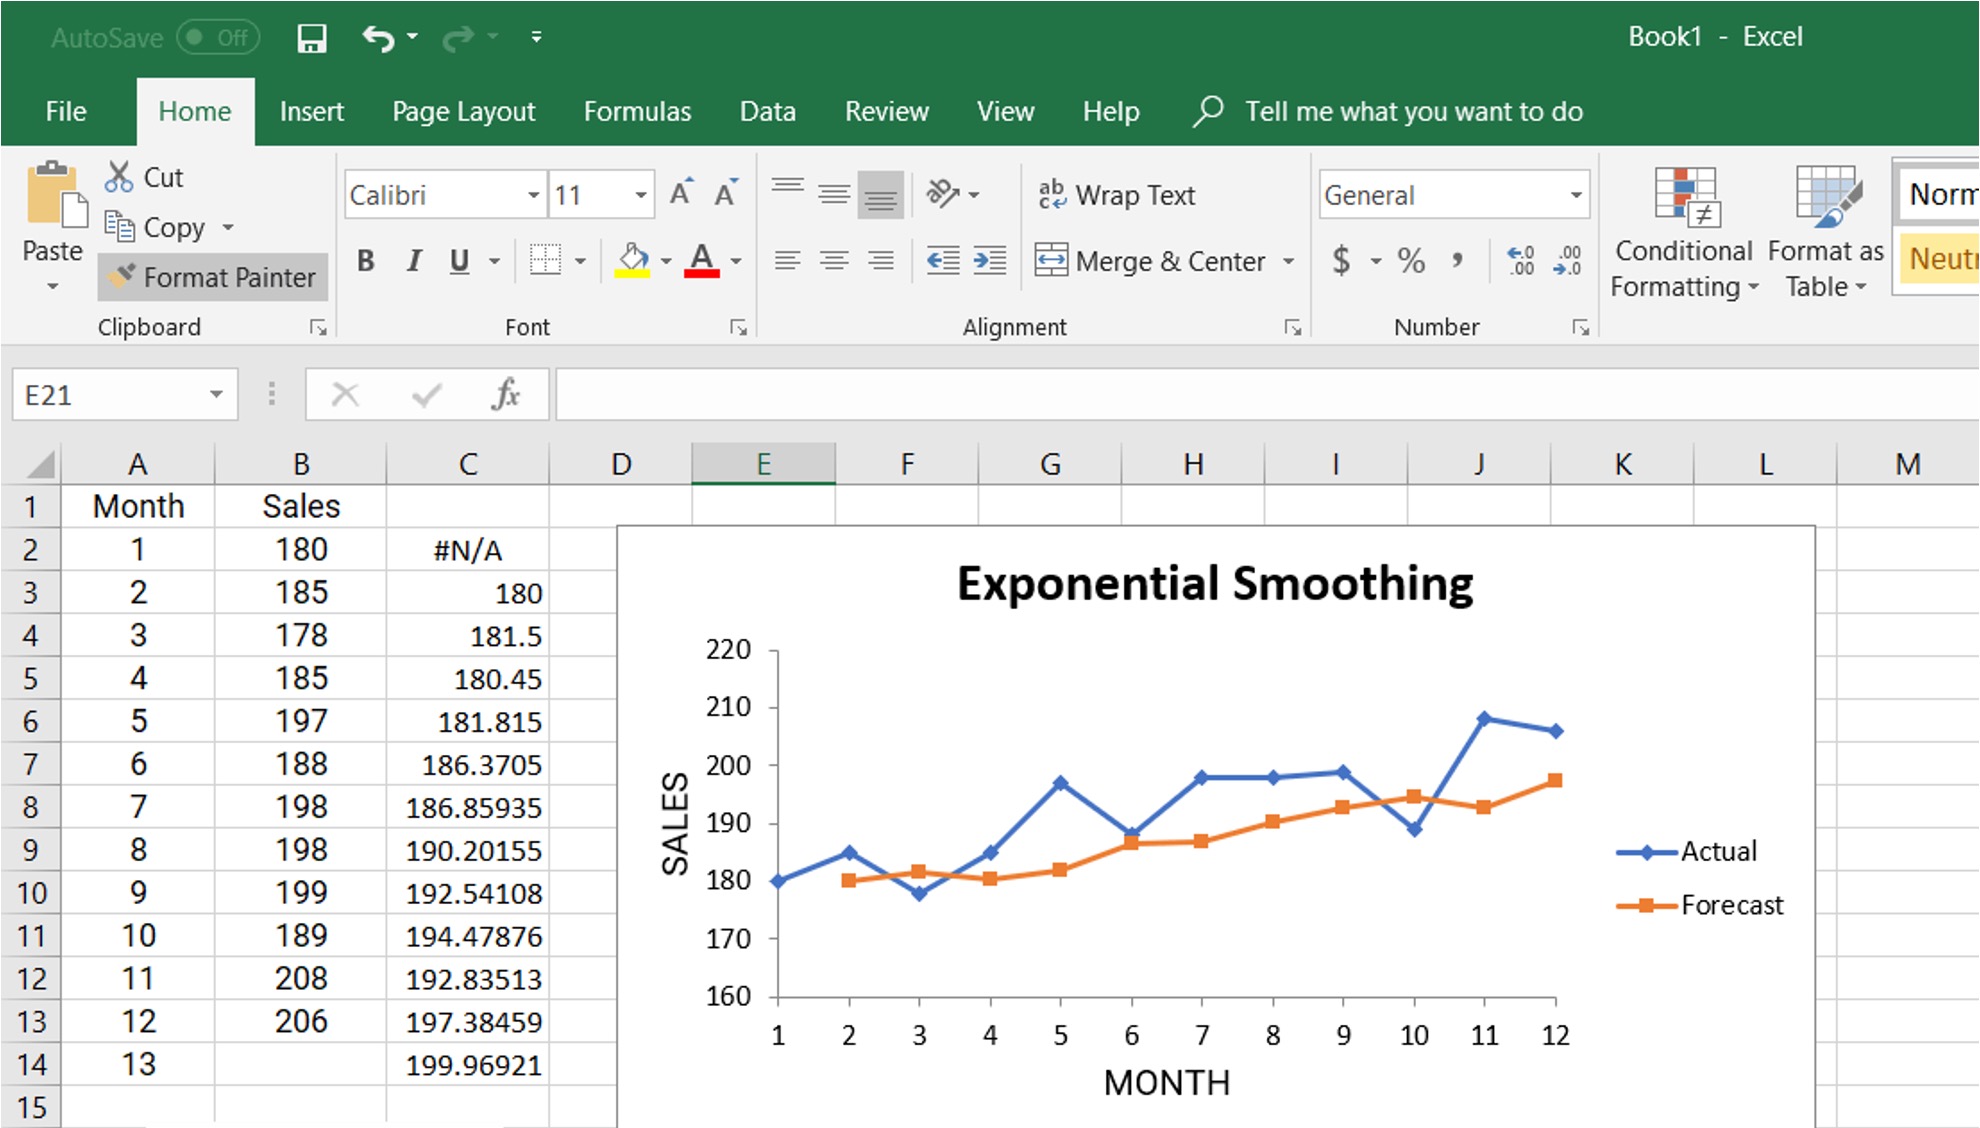
Creating a Line Graph
When it comes to visualizing data, a line graph can be an effective tool. It allows you to track trends and patterns over time, making it ideal for forecasting sales based on historical data. In this section, we will explore how to create a line graph in Excel to help you analyze and predict future sales.
To begin, open Excel and enter your historical sales data into a spreadsheet. Make sure to organize the data with two columns: one for the time period (such as months or quarters) and the other for the corresponding sales figures.
Once you have your data organized, select the entire range of cells containing the data. Then, click on the “Insert” tab at the top of the Excel window and choose the “Line” graph option from the charts section.
A new window will appear, showing various line graph options. Select the style that best suits your data and click “OK”. Excel will automatically generate a line graph based on the selected data range.
At this point, you may want to customize the appearance of your line graph. To do this, right-click on the graph and select “Format Data Series” from the context menu.
In the format data series window, you can modify the data series color, line style, and markers. You can also add axis titles, gridlines, and legends to make your graph more visually appealing and easier to understand.
Additionally, you can add trendlines to your line graph to help you identify patterns and project future sales. To add a trendline, right-click on a data point and select “Add Trendline” from the options menu.
In the Trendline options window, you can choose the type of trendline you want to add (such as linear or exponential) and customize its appearance. This will help you analyze the sales trend and make predictions based on the historical data.
Once you have customized your line graph and added the necessary trendlines, you can analyze the data to forecast future sales. Look for any patterns or trends in the graph and use that information to make predictions about future sales figures.
Remember, creating a line graph in Excel is just the first step. It is important to interpret and analyze the data accurately to make informed decisions about your sales forecasts. Keep in mind that there may be external factors that can influence sales, so it is essential to consider other variables as well.
By following these steps and effectively utilizing line graphs in Excel, you’ll be equipped with a powerful tool to forecast sales based on historical data. This can help you make informed business decisions and better plan for the future.
Applying Regression Analysis
Regression analysis is a statistical technique used to identify and analyze the relationship between variables. When it comes to forecasting sales based on historical data in Excel, regression analysis can be a powerful tool. It allows you to evaluate the pattern and trend in your data to make predictions for future sales.
To apply regression analysis for sales forecasting in Excel, follow these steps:
- Prepare the data: Ensure that your historical sales data is organized in a tabular format. You should have two columns – one for the independent variable (such as time) and another for the dependent variable (sales).
- Insert a scatter plot: Select your data and insert a scatter plot in Excel. This will provide you with a visual representation of the relationship between your variables.
- Calculate the regression equation: Using the data analysis tool in Excel, calculate the regression equation. This equation will help you estimate future sales based on the independent variable (time) and the coefficients obtained from the analysis.
- Plot the regression line: Add the regression line to your scatter plot to visualize the trend and make it easier to interpret the forecasted sales data.
- Predict future sales: With the regression equation, you can now predict future sales by entering the desired values for the independent variable (time) into the equation. Excel will automatically calculate the estimated sales based on the equation and the provided inputs.
Keep in mind that regression analysis assumes a linear relationship between the variables. If your data exhibits a more complex pattern, you may need to consider other statistical techniques or models to improve the accuracy of your sales forecast.
By applying regression analysis in Excel, you can gain valuable insights into the potential sales trends and make informed decisions for your business. It allows you to leverage historical data to anticipate future sales and adapt your strategies accordingly.
Interpreting the Forecasted Sales Data
Once you have successfully forecasted sales using Excel and regression analysis, the next step is to interpret the data to gain valuable insights. Analyzing the forecasted sales data can provide you with a better understanding of future trends and help you make strategic decisions for your business.
Here are some key aspects to consider when interpreting the forecasted sales data:
- Overall Sales Trend: Start by examining the overall trend in the forecasted sales data. Is it showing a steady upward or downward trajectory? This will give you an indication of the future direction of your sales and can help you plan accordingly.
- Seasonal Patterns: Look for any seasonal patterns in the forecasted sales data. Are there any recurring spikes or dips in sales during specific months or seasons? Understanding these patterns will enable you to adjust your marketing and inventory strategies to efficiently capitalize on high-demand periods.
- Outliers: Analyze any outliers in the data. Outliers are data points that deviate significantly from the overall trend or pattern. These outliers could result from external factors such as promotions, events, or changes in market conditions. Identifying and understanding the reasons behind outliers can help you refine your forecasting model and improve the accuracy of future predictions.
- Deviation from Historical Data: Compare the forecasted sales data with your historical sales data. Determine whether the forecast aligns with the past performance of your business. If there is a significant deviation, evaluate the potential reasons for the difference and assess the impact on your business strategy.
- Market and Competitive Analysis: Consider the broader market and competitive factors that may influence your sales. Analyze industry trends, competitive pricing, market demand, and consumer behavior. This analysis will provide you with a more holistic view of the forecasted sales data and enable you to make informed decisions to stay ahead of the competition.
Remember that forecasting is not an exact science, and there are always uncertainties and factors beyond your control. It is essential to regularly review and update your sales forecasts based on new data and market insights. By continuously monitoring and interpreting the forecasted sales data, you can adapt and optimize your business strategies to maximize revenue and achieve your goals.
Conclusion
Forecasting sales in Excel based on historical data is a valuable skill for businesses of all sizes. By accurately predicting future sales, companies can make informed decisions regarding inventory management, production planning, and resource allocation. Excel provides a powerful platform for creating reliable sales forecasts, allowing businesses to gain a competitive advantage in the market.
Throughout this article, we have explored various techniques and formulas that can be used to analyze historical sales data and generate accurate predictions for the future. From simple moving averages to advanced regression analysis, Excel offers a wide range of tools to meet your forecasting needs.
Remember, accurate forecasting requires a combination of quality historical data, careful data analysis, and an understanding of the factors that influence your sales. Continuously updating and refining your forecast models will enable you to make more informed decisions and keep up with changing market trends.
By employing the techniques and concepts discussed in this article, you can harness the power of Excel to gain valuable insights into your business’s future sales performance.
FAQs
1. What is sales forecasting?
Sales forecasting is the process of making predictions about future sales based on historical data, market trends, and other relevant factors. It helps businesses estimate future revenue, plan production and inventory, allocate resources, and make informed business decisions.
2. Why is sales forecasting important?
Sales forecasting is crucial for businesses of all sizes as it provides insights into future revenue streams and helps develop effective strategies. It allows businesses to anticipate market trends, plan for growth or downturns, optimize inventory levels, understand customer demand, and set realistic goals and targets.
3. How can I forecast sales in Excel?
Forecasting sales in Excel can be done by utilizing various techniques such as simple linear regression, moving averages, exponential smoothing, or using more advanced forecasting models. Excel provides mathematical and statistical functions that can be used to analyze historical data and generate sales forecasts.
4. What data do I need for sales forecasting?
To forecast sales in Excel, you will need historical sales data, preferably over a period of time. Additionally, you can incorporate other relevant data such as marketing campaigns, seasonality, economic indicators, customer feedback, and competitor analysis to improve the accuracy of your forecasts.
5. What are the benefits of using Excel for sales forecasting?
Using Excel for sales forecasting offers several benefits. It is a widely accessible and user-friendly software, allowing businesses of all sizes to leverage its tools and functions without the need for specialized software or technical expertise. Excel also provides customization options, visualizations, and the ability to perform complex calculations, making it a versatile tool for sales forecasting.