
Are you looking to annualize 3 months of data? Annualizing data is a common practice that allows you to project or estimate data for a full year based on a shorter time period. Whether you’re analyzing financial statements, sales figures, or any other type of data, annualizing can provide valuable insights and help with forecasting.
In this article, we will guide you through the process of annualizing 3 months of data. We’ll explain the concept, outline the steps involved, and provide some tips and examples to make the process easier. So, if you’re ready to dive into the world of data analysis and projection, let’s get started!
Inside This Article
- Definition of Annualization
- Methodology for Annualizing 3 Months of Data
- Considerations and Limitations of Annualizing 3 Months of Data
- Conclusion
- FAQs
Definition of Annualization
Annualization is a financial concept used to convert data from a shorter time period, such as 3 months, into an equivalent annual figure. It is a method widely used in various fields, including finance, economics, and business, to provide a standardized measure for comparison and analysis.
When data is annualized, it allows for better understanding and comparison of performance over different time periods. For example, if you have financial data for a quarter, annualizing it would provide an estimate of what the performance would be over a full year.
Annualization is particularly useful in situations where it is necessary to make projections, forecasts, or evaluate the performance of an investment or business over a longer time frame. By annualizing 3 months of data, you can gain insights and make more informed decisions based on a yearly perspective.
It is important to note that annualization assumes that the data from the shorter time period is representative of the entire year. This assumption is often reasonable for certain metrics, such as revenue or expenses, which tend to follow a consistent pattern throughout the year. However, for other variables that are subject to seasonality or volatility, annualization may provide a less accurate estimate.
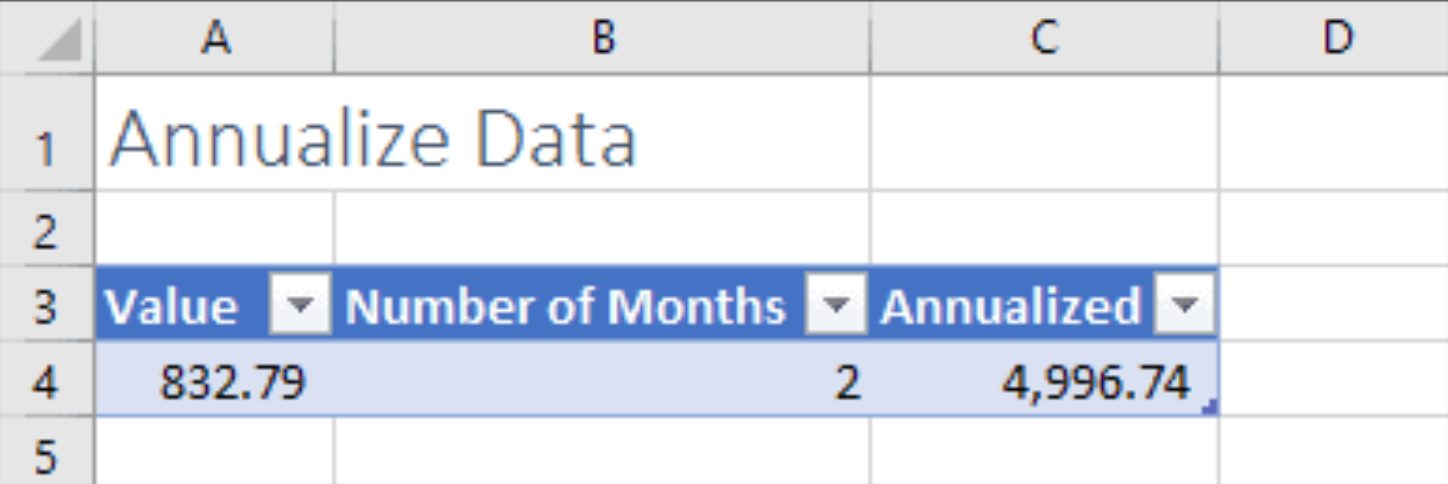
To annualize 3 months of data, you need to calculate the ratio between the time frame of the available data (3 months) and the desired time frame (12 months) and apply it to the data points. This can be done by multiplying the data points by the appropriate factor, which is calculated as the ratio between 12 months and the number of months in the available data.
It’s important to keep in mind that annualization is a simplification technique and should be used cautiously. It should not be used as a definitive measure, but rather as a tool for estimation and comparison purposes. Other factors, such as trends, market conditions, and external influences, should also be taken into account when interpreting annualized data.
Overall, annualization provides a way to project and analyze data over a longer time period by converting shorter-term data into an annual equivalent. It helps in gaining a better understanding of trends, making informed decisions, and facilitating meaningful comparisons across different time periods.
Methodology for Annualizing 3 Months of Data
When it comes to annualizing three months of data, there are a few key steps you can follow to ensure accurate and meaningful results. Here is a step-by-step methodology to guide you through the process:
1. Determine the Time Frame: Start by selecting the specific three-month period that you want to annualize. It’s important to choose a representative timeframe that aligns with your analysis or reporting objectives.
2. Calculate the Average: Next, calculate the average value for the variable you are analyzing over the selected three-month period. This could be a financial metric, such as revenue or expenses, or any other performance indicator relevant to your analysis.
3. Determine the Number of Periods: Determine the total number of three-month periods in a year. Since there are twelve months in a year, there are four three-month periods (quarters) in total.
4. Calculate the Annualized Value: To annualize the three-month data, multiply the average value obtained in step 2 by the number of periods in a year. For example, if the average revenue for the three-month period is $10,000 and there are four periods in a year, the annualized revenue would be $40,000.
5. Consider Seasonality: Take into account any seasonality factors that may impact your data. Depending on the nature of your data, the three-month period you have selected may not be fully representative of the entire year. Adjustments might need to be made to account for seasonal variations.
6. Communicate Results Clearly: Once you have annualized the three-month data, present your findings in a clear and concise manner. Use visualizations, graphs, or tables to effectively convey the annualized values and any relevant insights derived from the analysis.
Keep in mind that annualizing three months of data provides an estimate based on a short period and assumes the same trend will continue throughout the year. It is important to interpret the results with caution and consider any potential limitations or external factors that may impact the accuracy of the annualized values.
By following this methodology, you can effectively and accurately annualize three months of data, enabling you to gain valuable insights and make informed decisions based on the annual trends of your chosen variable.
Considerations and Limitations of Annualizing 3 Months of Data
While annualizing 3 months of data can provide some valuable insights, it is important to be aware of the considerations and limitations associated with this process. Here are a few key points to keep in mind:
1. Short-term volatility: Annualizing only 3 months of data may not capture the full picture of trends and patterns. Short-term market fluctuations and seasonal variations can greatly impact the results, leading to potentially skewed or misleading data.
2. Limited sample size: Working with a small sample size of just 3 months can introduce a level of uncertainty and increase the margin of error. This limited dataset may not accurately reflect the overall performance or long-term stability of a given metric or indicator.
3. Lack of historical context: Annualizing 3 months of data may not provide enough historical context to understand the underlying factors influencing the trends. Without a broader timeframe, it can be difficult to assess the true significance and sustainability of observed changes.
4. Extrapolation risks: Extrapolating trends based on a short-term dataset can be risky. It assumes that the same rate of change will continue over a longer period, which may not hold true for various reasons such as market shifts, changing consumer behavior, or external factors.
5. Seasonality and cyclical patterns: Certain industries or metrics may exhibit seasonal or cyclical patterns that cannot be adequately captured within a 3-month timeframe. Annualizing such data may overlook important nuances and lead to inaccurate projections.
6. Variability of data: In some cases, 3 months may not be representative enough to capture the full variability of the data. Statistical outliers or anomalies within this timeframe could significantly influence the annualized results, potentially distorting the overall picture.
7. Confidence and interpretation: It is crucial to understand that annualizing 3 months of data does not guarantee accuracy or certainty. The results should be interpreted with caution and accompanied by a clear acknowledgement of the inherent limitations and uncertainties associated with this approach.
While annualizing 3 months of data can provide a general indication of trends and performance, it is crucial to supplement this analysis with additional data, historical context, and a thorough understanding of the specific factors influencing the metrics in question. A more comprehensive and informed evaluation can help mitigate the limitations and provide a more reliable assessment of the situation.
Conclusion
Understanding how to annualize three months of data is crucial for individuals, businesses, and analysts alike. By extrapolating the data, it becomes possible to project trends, make forecasts, and develop strategic plans for the future.
When annualizing three months of data, it is important to consider any seasonal patterns or anomalies that may affect the accuracy of the results. Additionally, taking into account any external factors or events that may have influenced the data will ensure a more accurate and reliable analysis.
By utilizing appropriate calculation methods and techniques, such as the compound annual growth rate (CAGR) or averaging, it is possible to transform short-term data into a longer-term perspective. This allows for better decision-making, identifying potential areas of improvement, and setting realistic goals and targets.
Ultimately, annualizing three months of data provides valuable insights and helps to paint a clearer picture of overall trends and performance. Whether you are an investor, a business owner, or a data analyst, mastering this skill will undoubtedly contribute to better decision-making and more successful outcomes in the long run.
FAQs
1. What does it mean to annualize 3 months of data?
Annualizing 3 months of data refers to the process of converting the data from a quarterly (3 month) period to an annual (12 month) period. It is done by scaling up the data to represent a full year’s worth of information. This is often done to analyze trends, evaluate performance, or make projections for an entire year based on a shorter time frame.
2. Why would I need to annualize 3 months of data?
Annualizing 3 months of data can be useful in various scenarios. For example, if you have quarterly financial statements and want to compare them to annual benchmarks, you can annualize the data to get a complete picture. It can also be helpful when forecasting or making predictions based on a short-term dataset.
3. How do I calculate the annualized value for 3 months of data?
To annualize 3 months of data, multiply the value by 4. This assumes that each month has the same weight and provides a rough estimate of what the data would look like if it were extended for a full year. However, keep in mind that this approach assumes the same growth rate throughout the year, so it may not be accurate in all circumstances.
4. Are there any limitations to annualizing 3 months of data?
Yes, there are limitations to annualizing 3 months of data. For instance, if the data exhibits seasonality or significant fluctuations within a year, annualizing based on just 3 months may not capture the full picture accurately. Additionally, if there are external factors such as market changes or economic conditions that could impact the data, the annualized value may not provide an accurate representation.
5. Can I annualize data for any time period?
Yes, you can annualize data for any time period, not just 3 months. The process remains the same regardless of the duration you are working with. Just multiply the value by the appropriate factor based on the time period you want to annualize.