
Are you looking to annualize monthly data in Excel? Excel provides a powerful and efficient way to calculate annual figures from monthly data, making it easier to compare year-over-year trends and analyze long-term patterns. Whether you are a business owner, financial analyst, or simply someone working with data, knowing how to annualize your monthly figures can provide valuable insights.
In this article, we will guide you through the step-by-step process of annualizing monthly data in Excel. We will explore different methods and formulas that you can use to convert monthly values into annual values. Whether you have a single column of monthly data or multiple columns representing different variables, we’ve got you covered.
So, if you’re ready to learn how to transform your monthly data into annual figures using Excel, let’s dive in!
Inside This Article
- What is Annualization?
- Why Annualize Monthly Data?
- Method 1: Simple Annualization Calculation
- Method 2: Compound Annual Growth Rate (CAGR)
- Method 3: Average Monthly Growth Rate
- Method 4: Seasonal Adjustment Methods
- Conclusion
- FAQs
What is Annualization?
Annualization is a process used to convert data from one time period to another, typically from a shorter time period to a longer time period. It involves adjusting the value of data to reflect what it would be over the course of a full year, assuming the same growth rate or pattern.
This technique is particularly useful when dealing with financial or economic data that is reported in shorter intervals, such as monthly or quarterly figures. By annualizing this data, analysts and researchers are able to make more accurate comparisons and projections over longer periods.
There are various methods and formulas that can be employed to annualize data, depending on the nature of the information and the desired level of accuracy. These methods take into account factors such as seasonality, growth rates, and adjustments for inflation.
Overall, annualization allows for better analysis and decision-making by providing a standardized view of data over a consistent time frame.
Why Annualize Monthly Data?
Annualizing monthly data is essential when you want to analyze trends, compare performance, or make projections on an annual basis. While monthly data provides valuable insights into short-term fluctuations, it may not provide a comprehensive view of long-term trends. By annualizing the data, you can better understand the overall performance of a business, investment, or any other variable over a longer time frame.
Here are a few reasons why annualizing monthly data is important:
- Comparability: Annualizing the data allows for easy comparison between different periods, years, or entities. It standardizes the data and makes it consistent across the board, ensuring accurate analysis and decision making.
- Trend analysis: Annualization enables you to identify and analyze long-term trends. It helps in understanding whether a variable is growing, declining, or remaining stable over time, which is crucial for strategic planning and forecasting.
- Accuracy in forecasting: If you are making projections or forecasts for future periods, annualized data provides a more accurate basis for prediction. It considers the overall trend and eliminates short-term fluctuations, resulting in more reliable forecasts.
- Performance evaluation: Annualized data is commonly used to evaluate the performance of businesses or investments over time. It allows for a comprehensive assessment of growth rates, returns, and other key performance indicators, facilitating informed decision making.
- Investment analysis: Annualized data is crucial in the evaluation of investment opportunities. It helps in determining the return on investment (ROI), assessing risk-adjusted returns, and comparing different investment options on an annual basis.
Overall, annualizing monthly data provides a holistic view of trends, facilitates accurate forecasting, aids in performance evaluation, and enables meaningful comparisons. It is an important analytical tool that adds depth and context to the data, empowering decision-makers to make informed choices based on a broader time horizon.
Method 1: Simple Annualization Calculation
One of the easiest methods to annualize monthly data in Excel is by using a simple annualization calculation. This method involves multiplying the monthly data by 12 to estimate its value over a year. This approach assumes a constant growth rate throughout the year.
To apply the simple annualization calculation, you can follow these steps:
- Select the cell where you want to display the annualized result.
- Enter the formula “= monthly data * 12” in the selected cell.
- Press Enter to calculate and display the annualized value.
For example, if your monthly sales data is in cell A1, you can use the formula “= A1 * 12” to annualize the sales.
This method is quick and straightforward, making it suitable for cases where the growth pattern remains relatively stable throughout the year. However, it may not accurately capture seasonality or irregular fluctuations in the data.
Keep in mind that using a simple annualization calculation assumes a linear growth pattern. If your data exhibits non-linear growth or fluctuates significantly throughout the year, other methods such as compound annual growth rate (CAGR) or seasonal adjustment may provide more accurate results.
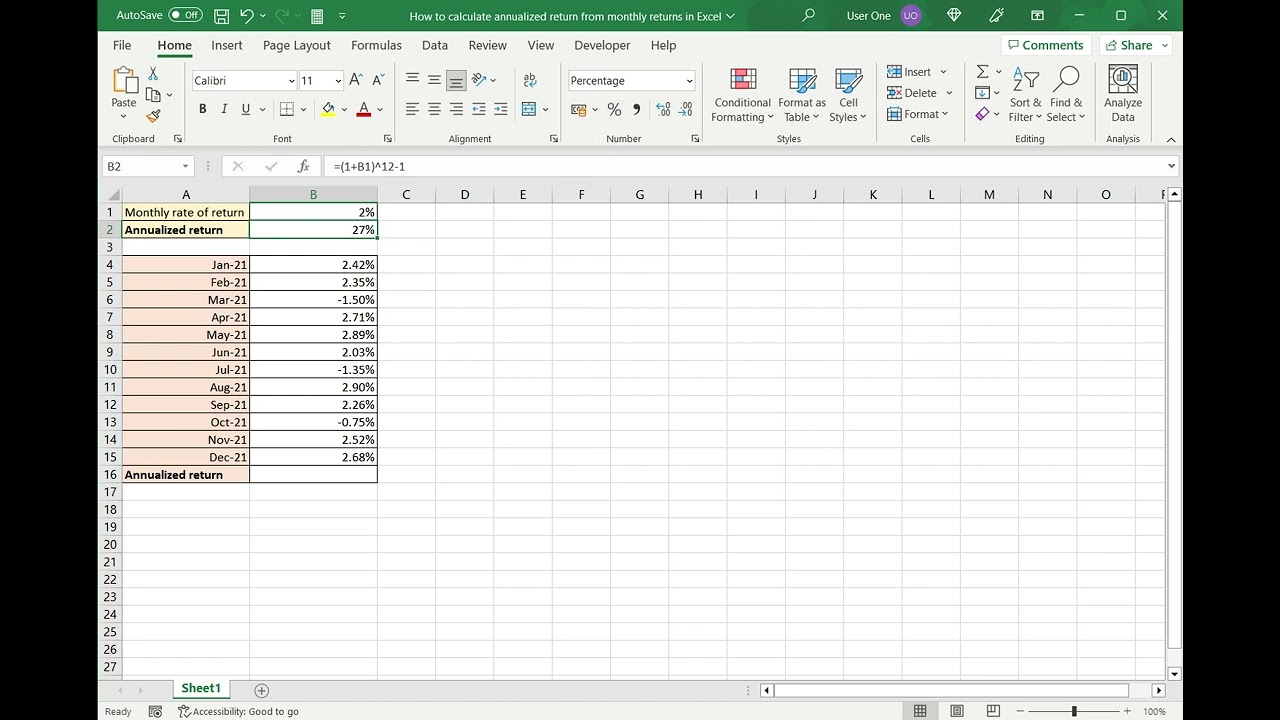
Method 2: Compound Annual Growth Rate (CAGR)
When it comes to annualizing monthly data, one commonly used method is the Compound Annual Growth Rate (CAGR). This method provides a more accurate representation of the growth rate over a certain period.
To calculate the CAGR, you need to know the starting value, ending value, and the number of periods involved. In the case of annualizing monthly data, the starting value would be the value at the beginning of the period, the ending value would be the value at the end of the period, and the number of periods would be the number of months.
The formula to calculate the CAGR is as follows:
CAGR = (Ending Value / Starting Value) ^ (1 / Number of Periods) – 1
Let’s say you want to annualize the monthly growth rate of a stock over a 12-month period. If the starting value of the stock is $100 and the ending value is $150, you would substitute these values into the formula:
CAGR = (150 / 100) ^ (1 / 12) – 1
Using a calculator, you would calculate the value inside the parentheses first, and then subtract 1 to get the final result. In this example, the CAGR would be approximately 0.1137 or 11.37%.
The CAGR provides a better understanding of the average growth rate over the given period, taking into account the compounding effect of monthly fluctuations. This method is widely used for various financial calculations, including investment returns and business performance analysis.
One important thing to note is that the CAGR assumes a steady growth rate over the entire period. If there are significant fluctuations in growth rate during the period, the CAGR may not accurately reflect the actual performance. In such cases, it may be necessary to consider other methods or make adjustments to the data.
Using the CAGR method to annualize monthly data in Excel requires a basic understanding of formulas and functions. By using the POWER function and subtraction operator, you can easily compute the CAGR for your data set.
Once you have calculated the CAGR, you can use it to project future values based on the historical growth rate. This can be particularly useful for forecasting purposes or evaluating investment opportunities.
Overall, the CAGR method provides a robust approach to annualizing monthly data, allowing for a more comprehensive analysis of growth rates. By applying this method, you can gain valuable insights into trends and make informed decisions based on the projected annualized figures.
Method 3: Average Monthly Growth Rate
Another method to annualize monthly data in Excel is by using the average monthly growth rate. This method takes into account the fluctuation in values from month to month and calculates the average rate of change over the desired period of time.
To start, you need to gather the monthly data you want to annualize. It is important to have a consistent and reliable dataset for accurate calculations. Once you have your monthly data, follow these steps:
- Calculate the percentage change for each month by taking the difference between the current month and the previous month, and then dividing it by the previous month’s value. Multiply the result by 100 to get the percentage change.
- Compute the average of the monthly percentage changes by summing up all the percentage changes and dividing it by the number of months.
- Add 1 to the average monthly growth rate (expressed as a decimal). This is because the growth rate represents the multiplier for each month. By adding 1, you get the total growth over the period.
- Raise the total growth rate to the power of 12 (since there are 12 months in a year) to compound the growth and get the annualized rate.
Let’s illustrate this method with an example. Suppose you have monthly sales data for a year, and you want to annualize it:
Month 1: $10,000
Month 2: $12,000
Month 3: $9,000
Month 4: $11,000
Month 5: $13,000
Month 6: $14,000
Month 7: $12,500
Month 8: $15,000
Month 9: $11,500
Month 10: $13,500
Month 11: $12,000
Month 12: $14,500
Using the above data, you would first calculate the monthly percentage changes:
Month 2: (($12,000 – $10,000) / $10,000) * 100 = 20%
Month 3: (($9,000 – $12,000) / $12,000) * 100 = -25%
Month 4: (($11,000 – $9,000) / $9,000) * 100 = 22.22%
Month 5: (($13,000 – $11,000) / $11,000) * 100 = 18.18%
Month 6: (($14,000 – $13,000) / $13,000) * 100 = 7.69%
Month 7: (($12,500 – $14,000) / $14,000) * 100 = -10.71%
Month 8: (($15,000 – $12,500) / $12,500) * 100 = 20%
Month 9: (($11,500 – $15,000) / $15,000) * 100 = -23.33%
Month 10: (($13,500 – $11,500) / $11,500) * 100 = 17.39%
Month 11: (($12,000 – $13,500) / $13,500) * 100 = -11.11%
Month 12: (($14,500 – $12,000) / $12,000) * 100 = 20.83%
Next, calculate the average monthly growth rate:
Average growth rate = (20% – 25% + 22.22% + 18.18% + 7.69% – 10.71% + 20% – 23.33% + 17.39% – 11.11% + 20.83%) / 12
Average growth rate = 3.74%
Now, add 1 to the average growth rate:
Total growth rate = 1 + 0.0374 = 1.0374
Finally, raise the total growth rate to the power of 12 to annualize the growth:
Annualized growth rate = (1.0374)^12 – 1 = 0.4914 or 49.14%
So, the annualized growth rate for the given monthly sales data is approximately 49.14%.
Using the average monthly growth rate method allows you to take into account the fluctuations in monthly data and gives a more accurate representation of the annual growth. This method is especially useful when dealing with volatile or seasonal data.
Now that you know the steps to annualize monthly data using the average monthly growth rate method, you can apply this technique to any relevant data set in Excel.
Method 4: Seasonal Adjustment Methods
When it comes to analyzing and annualizing monthly data, accounting for seasonal variations becomes crucial. Seasonal adjustment methods are used to remove the effects of seasonal patterns and fluctuations in the data, allowing for a more accurate assessment of the underlying trend.
There are various techniques and approaches for seasonal adjustment, each with its own benefits and limitations. Let’s explore a few commonly used methods:
- X-12-ARIMA: This method employs an iterative process that combines autoregressive integrated moving average (ARIMA) modeling and regression techniques. It is a powerful tool for identifying and removing seasonal patterns in monthly data.
- TRAMO/SEATS: TRAMO (Time series Regression with ARIMA noise, Missing values, and Outliers) and SEATS (Signal Extraction in ARIMA Time Series) are two separate programs that work together to decompose and remove seasonality. TRAMO focuses on identifying and modeling the underlying trend and irregular component, while SEATS deals with estimating and adjusting the seasonal component.
- Ratio-to-Moving-Average: This method compares the ratio of each observation to a moving average of the corresponding seasonally lagged observation. By calculating this ratio, it is possible to isolate and remove the effects of seasonality, leaving behind a more stable and comparable trend.
- Fourier Analysis: Fourier analysis utilizes the Fourier transform to decompose the time series into its frequency components. This method is particularly useful for identifying and extracting seasonal patterns that have a regular and repeating pattern over time.
Each seasonal adjustment method has its own advantages and is suitable for different types of data and analysis objectives. It’s important to choose the appropriate technique based on the specific requirements of your analysis.
By applying seasonal adjustment methods, you can effectively annualize monthly data by removing the seasonal effects and obtaining a more accurate representation of the underlying trend. This allows for better decision-making, forecasting, and comparison of data across different time periods.
To ensure the best results, it is recommended to consult with experts or refer to specialized software packages that offer comprehensive seasonal adjustment capabilities.
Conclusion
Annualizing monthly data in Excel can be a useful technique for gaining insights into long-term trends and making comparisons across different periods. By using simple mathematical calculations and leveraging Excel’s built-in functions, you can easily convert monthly data into annual figures.
Throughout this article, we have explored various methods to annualize monthly data. Whether you choose to use the power of formulae or take advantage of Excel’s powerful tools like the CAGR function, each approach provides a valuable way to analyze and visualize data in a meaningful way.
Remember, when working with financial data or any other type of time series data, annualizing can help to reveal the bigger picture and provide a clearer understanding of underlying trends. So go ahead and put these techniques to use in your Excel spreadsheets and unlock new insights from your monthly data!
FAQs
1. What is annualizing monthly data in Excel?
Annualizing monthly data in Excel means converting monthly data into yearly data by projecting the monthly values over a 12-month period. This allows for easier comparison and analysis of data on an annual basis.
2. How can I annualize monthly data in Excel?
To annualize monthly data in Excel, you can use the formula: =MonthlyValue * 12. Simply multiply the monthly value by 12 to get the annualized value. You can apply this formula to each monthly data point to get the corresponding yearly value.
3. Can I annualize data that has missing monthly values?
Yes, you can still annualize data even if there are missing monthly values. However, it’s important to note that the accuracy of the annualized data may be affected by the missing values. In such cases, it’s recommended to use interpolation or estimates to fill in the missing values before annualizing the data.
4. Can I annualize data with different monthly intervals?
Yes, it is possible to annualize data even if the monthly intervals are not the same. However, you will need to adjust the formula accordingly. For example, if the data is based on quarterly values, you would multiply the quarterly value by 4 instead of 12 to annualize it.
5. Can I use Excel functions to annualize monthly data?
Yes, Excel provides several functions that can assist in annualizing monthly data. The most commonly used function is the SUM function, which can be combined with other functions like AVERAGE or MAX to calculate annualized values. Additionally, you can use functions like YEAR or MONTH to extract specific values from date columns and perform calculations accordingly.