
Are you looking to enhance your data analysis capabilities in Excel? Adding the Data Analysis Toolpak can be a game-changer. Excel’s Data Analysis Toolpak is a powerful add-in that provides a range of data analysis and statistical functions to help you make sense of your data. Whether you’re analyzing sales figures, evaluating market trends, or conducting complex calculations, having the Data Analysis Toolpak at your disposal can simplify your tasks and unlock valuable insights. In this article, we’ll guide you through the steps to add the Data Analysis Toolpak to your Excel application, allowing you to leverage its advanced features and take your data analysis skills to the next level. So, let’s dive in and explore how you can easily integrate this essential add-in into Excel.
Inside This Article
- How to Add Data Analysis Toolpak in Excel
- Installing the Data Analysis Toolpak
- Enabling the Data Analysis Toolpak
- Accessing the Data Analysis Toolpak in Excel
- Using the Data Analysis Toolpak for Data Analysis
- Conclusion
- FAQs
How to Add Data Analysis Toolpak in Excel
If you’re using Excel for data analysis, you’ll want to take advantage of the powerful features offered by the Data Analysis Toolpak. This add-in provides a wide range of statistical analysis tools that can help you make informed decisions and gain valuable insights from your data. In this article, we’ll walk you through the steps to add the Data Analysis Toolpak to Excel, enabling you to unlock its full potential.
1. Installing the Data Analysis Toolpak:
To begin, you need to ensure that the Data Analysis Toolpak is installed on your computer. By default, this add-in is not installed in Excel, so you’ll need to manually install it. Here’s how:
- Open Excel and click on the “File” tab in the top left corner.
- Select “Options” from the dropdown menu.
- A new window will appear. Click on “Add-Ins” from the left-hand side.
- At the bottom of the window, you’ll see a dropdown menu labeled “Manage”. Select “Excel Add-ins” and click on the “Go” button.
- In the Add-Ins window, check the box next to “Analysis ToolPak” and click “OK”.
- Excel will install the Data Analysis Toolpak, and you’ll see a new “Data Analysis” button in the Data tab on the Excel ribbon.
2. Enabling the Data Analysis Toolpak:
Once the Data Analysis Toolpak is installed, you need to enable it to access the advanced statistical analysis functions. Here’s how:
- Open Excel and click on the “Data” tab on the Excel ribbon.
- In the “Analysis” group, you’ll find the “Data Analysis” button. Click on it.
- A new window will appear with a list of available analysis tools. If you don’t see this window, it means the Data Analysis Toolpak is not enabled.
- To enable the Toolpak, click on the “File” tab in the top left corner of the Excel window.
- Select “Options” from the dropdown menu.
- In the Excel Options window, click on “Add-Ins” from the left-hand side.
- At the bottom of the window, you’ll see a dropdown menu labeled “Manage”. Select “Excel Add-ins” and click on the “Go” button.
- In the Add-Ins window, check the box next to “Analysis ToolPak” and click “OK”.
- The Data Analysis Toolpak will now be enabled, and you can access its features through the “Data” tab.
3. Accessing the Data Analysis Toolpak in Excel:
With the Data Analysis Toolpak installed and enabled, you can easily access its functions for data analysis. Here’s how:
- Open Excel and open the workbook containing the data you want to analyze.
- Click on the “Data” tab on the Excel ribbon.
- In the “Analysis” group, click on the “Data Analysis” button.
- A window will appear with a list of available analysis tools, such as Regression, Descriptive Statistics, and Histogram.
- Select the analysis tool you want to use, and follow the prompts to input the necessary data and settings.
- Once you’ve completed the analysis, Excel will generate the results in a new sheet or dialog box, depending on the specific analysis tool.
4. Using the Data Analysis Toolpak for Data Analysis:
The Data Analysis Toolpak offers a wide range of functions for data analysis. Here are a few key tools that can help you analyze your data:
- Descriptive Statistics: Calculate measures of central tendency, variability, and other descriptive statistics for your data.
- Histogram: Create a histogram to visualize the distribution of data.
- Regression: Perform regression analysis to assess the relationship between variables.
- T-Test: Conduct a t-test to compare means between two groups of data.
- ANOVA: Perform analysis of variance to compare means between multiple groups.
By utilizing the Data Analysis Toolpak in Excel, you can easily perform complex statistical analysis and gain valuable insights from your data. Start exploring the various tools and unlock the power of data analysis in Excel.
Installing the Data Analysis Toolpak
The Data Analysis Toolpak is a powerful add-in for Microsoft Excel that provides advanced data analysis capabilities. By installing this toolpak, users can access a wide range of statistical analysis, data visualization, and forecasting functions. Here’s a step-by-step guide on how to install the Data Analysis Toolpak in Excel:
Step 1: Open Microsoft Excel on your computer. Click on the “File” tab located at the top left corner of the Excel window.
Step 2: In the File menu, select “Options” from the left-hand panel. This will open the Excel Options dialog box.
Step 3: Within the Excel Options dialog box, click on “Add-Ins” on the left-hand panel.
Step 4: In the “Manage” dropdown menu at the bottom of the Add-Ins screen, select “Excel Add-ins” and click on the “Go” button.
Step 5: The Add-Ins dialog box will appear. Check the box next to “Analysis Toolpak” and click on the “OK” button.
Step 6: Excel will now install the Data Analysis Toolpak. This may take a few moments depending on your computer’s processing speed. Once the installation is complete, you’ll see a confirmation message.
Step 7: Close the Excel Options dialog box by clicking on the “OK” button.
Step 8: You have successfully installed the Data Analysis Toolpak in Excel. You can now access the toolpak’s functions and features for advanced data analysis tasks.
By following these steps, you can easily install the Data Analysis Toolpak in Excel and unlock a range of powerful data analysis capabilities. Whether you need to perform statistical analysis, create forecasts, or visualize data, the Toolpak is a valuable addition to your Excel toolkit.
Enabling the Data Analysis Toolpak
To utilize the powerful features offered by the Data Analysis Toolpak in Excel, you first need to enable it. Follow these simple steps to enable the Toolpak and unlock a plethora of data analysis functions:
1. Open Excel and go to the “File” tab located in the upper left corner of the screen.
2. From the dropdown menu, select “Options.” This will open the Excel Options dialog box.
3. In the Excel Options dialog box, click on “Add-Ins” from the left-hand side menu.
4. Look for the “Manage” dropdown menu at the bottom of the dialog box, and select “Excel Add-ins.” Then click on “Go.”
5. In the Add-Ins dialog box, you will see a list of available add-ins for Excel. Look for the entry for “Analysis ToolPak” and check the box next to it.
6. After checking the box, click on “OK” to enable the Data Analysis Toolpak.
7. Excel will then install the Toolpak and show a progress bar during the installation process. Once the installation is complete, click on “OK” to close the Add-Ins dialog box.
8. Congratulations! You have successfully enabled the Data Analysis Toolpak in Excel. You can now access all the data analysis functions provided by the Toolpak.
It’s important to note that enabling the Data Analysis Toolpak may require administrative access to your computer. If you don’t have the necessary permissions, you may need to contact your IT department or system administrator for assistance. Additionally, the steps to enable the Toolpak may vary slightly depending on the version of Excel you are using.
Once you have enabled the Data Analysis Toolpak, you can move on to the next step of accessing and utilizing its powerful data analysis functions.
Accessing the Data Analysis Toolpak in Excel
Once you have successfully installed and enabled the Data Analysis Toolpak in Excel, you can easily access it to perform various data analysis tasks. To access the Toolpak, follow these simple steps:
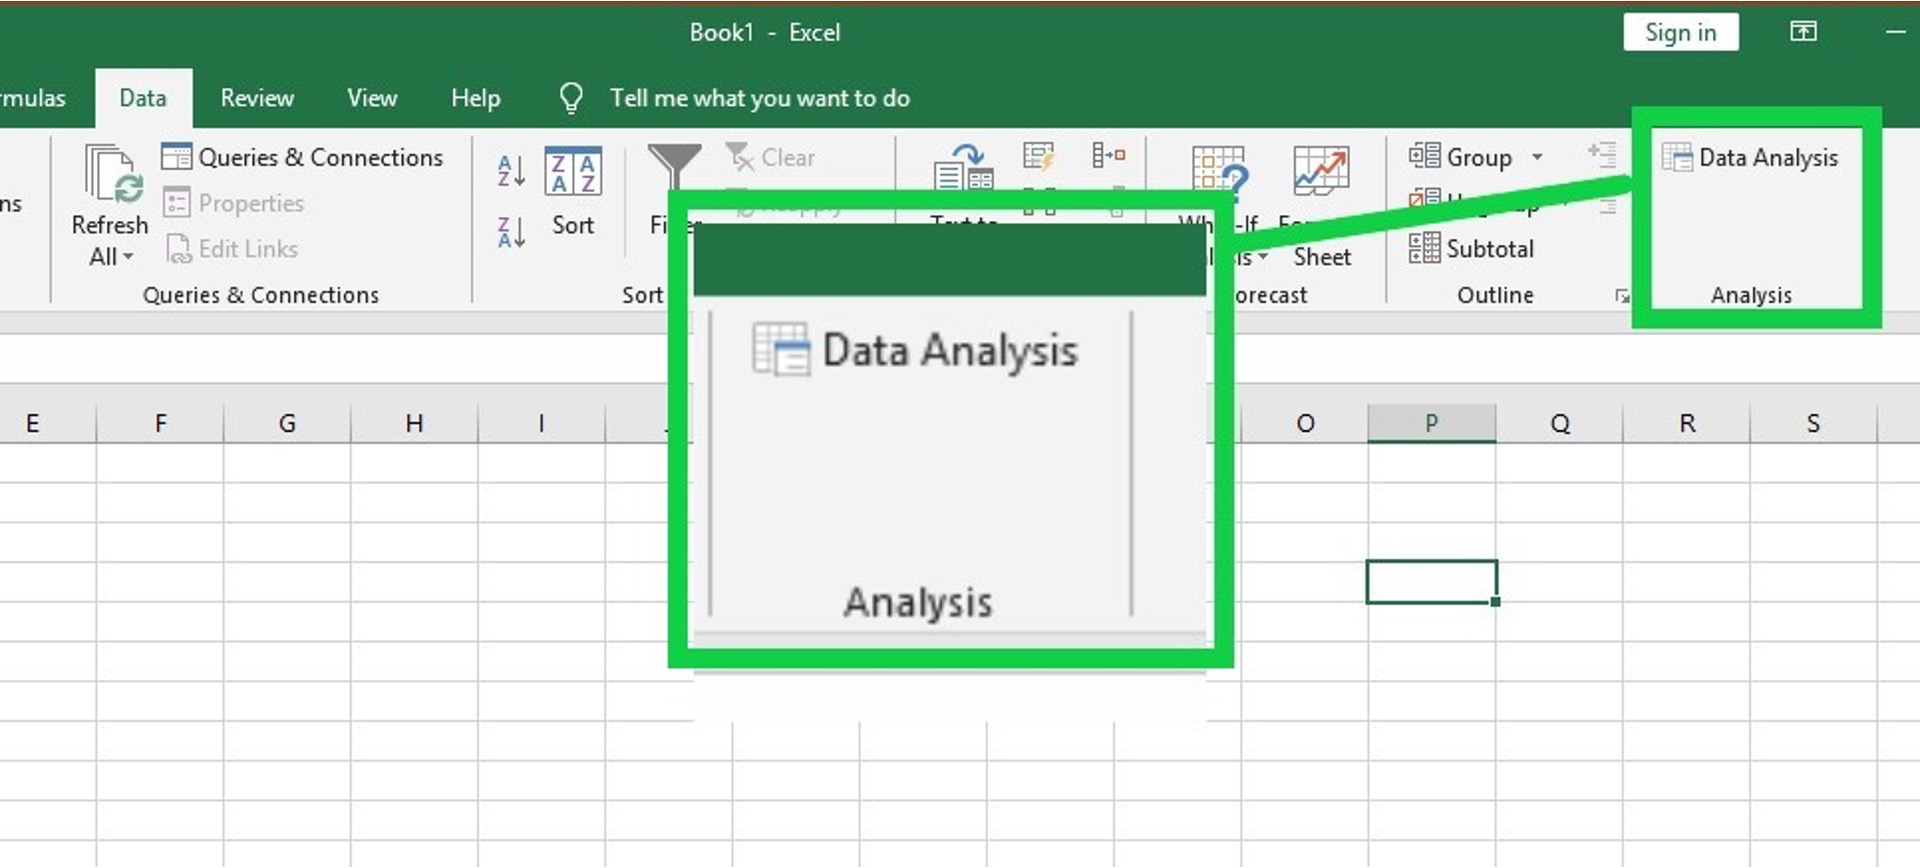
1. Open Excel and navigate to the “Data” tab in the ribbon at the top of the window.
2. Look for the “Analysis” group on the far right side of the ribbon.
3. Within the “Analysis” group, you will find the “Data Analysis” button. Click on this button to open the Data Analysis dialog box.
4. In the Data Analysis dialog box, you will see a list of available analysis tools provided by the Toolpak. Select the analysis tool that best suits your needs and click on it.
5. Depending on the selected analysis tool, you may need to enter some input data or specify additional parameters. Fill in the required information and click “OK” to initiate the analysis process.
6. The analysis results will be generated and displayed in a new worksheet or dialog box, depending on the nature of the analysis. Take a moment to review and interpret the results to gain insights from your data.
With these simple steps, you can easily access the Data Analysis Toolpak in Excel and start performing a wide range of data analysis tasks. This powerful tool will help you uncover valuable insights and make informed decisions based on your data.
Using the Data Analysis Toolpak for Data Analysis
Now that you have successfully installed and enabled the Data Analysis Toolpak in Excel, it’s time to explore how you can utilize this powerful tool for data analysis. The Data Analysis Toolpak provides a wide range of statistical analysis and data manipulation capabilities that can help you gain valuable insights from your data.
Here are some of the key features and functions of the Data Analysis Toolpak:
- Descriptive Statistics: The Data Analysis Toolpak offers various options to calculate descriptive statistics such as mean, median, mode, standard deviation, and quartiles. These statistics provide a summary of the data distribution and help you understand the central tendency and variability of your dataset.
- Histogram: With the Data Analysis Toolpak, you can easily create histograms to visualize the frequency distribution of your data. Histograms are especially useful for identifying patterns, outliers, and understanding the overall data distribution.
- Regression Analysis: If you are interested in exploring the relationship between variables, the Data Analysis Toolpak provides regression analysis functions. You can perform simple linear regression, multiple linear regression, and polynomial regression to model and analyze the relationships in your dataset.
- ANOVA: Analysis of Variance (ANOVA) is a statistical technique used to determine if there are any significant differences between the means of two or more groups. The Data Analysis Toolpak offers ANOVA functions that allow you to compare means and assess the significance of these differences.
- Sampling: The Data Analysis Toolpak includes options for random sampling and stratified sampling. These sampling techniques are useful when you want to select a subset of your data for analysis while ensuring that the sample is representative of the entire population.
- Correlation: Correlation analysis helps you understand the relationship between two variables and measure the strength and direction of that relationship. The Data Analysis Toolpak provides functions for calculating correlation coefficients such as Pearson’s correlation coefficient and Spearman’s rank correlation coefficient.
- Forecasting: With the Data Analysis Toolpak, you can apply various forecasting methods such as exponential smoothing and moving averages to predict future values based on historical data. This can be particularly useful for business planning and decision-making.
By utilizing the Data Analysis Toolpak in Excel, you can perform a wide range of statistical analysis and gain valuable insights from your data. Whether you need to calculate descriptive statistics, create visualizations, analyze relationships between variables, or make forecasts, the Data Analysis Toolpak has got you covered.
Remember, practice makes perfect! Don’t hesitate to explore and experiment with the different functions and features of the Data Analysis Toolpak to deepen your understanding of your data and make informed decisions.
Conclusion
The Data Analysis Toolpak in Excel is a powerful feature that allows users to perform advanced data analysis and make informed decisions. By enabling this toolpak, users gain access to a wide range of statistical and analytical tools that can help them uncover valuable insights from their data.
Adding the Data Analysis Toolpak in Excel is a simple process that can be done in a few easy steps. Whether you’re a data analyst, a business professional, or a student, having this toolpak installed can greatly enhance your data analysis capabilities and make your work more efficient.
With the Data Analysis Toolpak, you can perform tasks like regression analysis, hypothesis testing, forecasting, and much more. It empowers you to make data-driven decisions, identify trends, and discover patterns that might otherwise go unnoticed.
So, don’t miss out on the benefits of the Data Analysis Toolpak in Excel. Take a few moments to enable it, and unlock a world of data analysis possibilities.
FAQs
1. How do I add Data Analysis Toolpak in Excel?
To add the Data Analysis Toolpak in Excel, you need to go to the ‘File’ tab, click on ‘Options,’ select ‘Add-Ins’ from the left-hand menu, and then choose ‘Excel Add-ins’ from the Manage drop-down menu. Click on ‘Go,’ check the box next to ‘Analysis Toolpak,’ and click ‘OK.’ The Data Analysis Toolpak will then be added to your Excel toolbar.
2. What is the purpose of the Data Analysis Toolpak in Excel?
The Data Analysis Toolpak is an add-in for Excel that provides various data analysis and statistical tools. It allows users to perform complex calculations, generate descriptive statistics, create histograms, develop regression models, perform data sampling, and much more. The Toolpak is particularly useful for researchers, analysts, and professionals working with large datasets.
3. Can I use the Data Analysis Toolpak for predictive modeling?
Yes, the Data Analysis Toolpak in Excel provides tools for predictive modeling, including regression analysis and multiple regression analysis. These tools allow you to analyze the relationship between variables and make predictions based on the data. They are particularly helpful in forecasting future trends or making decisions based on historical data.
4. Is the Data Analysis Toolpak available in all versions of Excel?
The availability of the Data Analysis Toolpak may vary based on the version of Excel you are using. In some older versions, such as Excel 2007, it may not be available by default. However, you can typically add it as an add-in by following the steps mentioned in the first FAQ. In newer versions of Excel, such as Excel 2016 and Excel 365, the Toolpak is usually readily available.
5. Are there any prerequisites or requirements for using the Data Analysis Toolpak?
To use the Data Analysis Toolpak in Excel, you need to have a properly installed and activated version of Microsoft Excel. The Toolpak is a built-in feature in Excel, but in some cases, you may need to install it as an add-in, as mentioned earlier. Additionally, while the Toolpak provides a range of powerful statistical tools, it is essential to have a basic understanding of statistics and data analysis to make the most of its capabilities.