
Tableau is a powerful data visualization tool that allows users to analyze and present data in a visually appealing and intuitive way. One of the key features of Tableau is its ability to blend data from multiple sources, enabling users to gain valuable insights and make data-driven decisions.
Blending data in Tableau involves combining data from different tables or data sources into a single, cohesive dataset. This process allows users to easily create relationships between different data elements and generate dynamic visualizations that provide a comprehensive view of the data.
In this article, we will explore the step-by-step process of blending data in Tableau, including connecting to multiple data sources, creating data relationships, and leveraging the power of Tableau’s visualizations to uncover hidden patterns and trends.
Inside This Article
- Understanding Data Blending in Tableau
- Preparing Your Data for Blending – Data Source Requirements – Combining Multiple Data Sources
- Blending Data in Tableau- Connecting to data sources- Identifying common data fields- Applying blend methods
- Tips and Best Practices for Data Blending in Tableau
- Conclusion
- FAQs
Understanding Data Blending in Tableau
Data blending in Tableau is a crucial technique that allows you to combine data from multiple sources into a single view or analysis. It enables you to bridge the gap between various data sets and draw meaningful insights from the combined information. By blending data, you can merge information from different databases, files, or even live connections, without the need for complex data integration processes.
So, what exactly is data blending? In Tableau, data blending refers to the process of joining or linking data that resides in separate sources, such as databases, Excel files, or web services. It allows you to connect to different data sets and combine them based on common fields or dimensions. This way, you can seamlessly analyze and visualize data from multiple perspectives, enhancing your ability to make informed decisions.
Data blending is particularly important in Tableau because it offers immense flexibility and agility in working with data. It allows you to easily incorporate data from various sources and blend them in real-time, without the need for complex data transformation or consolidation. This empowers you to explore relationships, patterns, and trends that might not be apparent when looking at individual data sources alone.
In addition, data blending enables you to bridge gaps in your data analysis by integrating disparate data sets. For example, if you have sales data in one data source and customer information in another, data blending allows you to combine these sources to gain a holistic view of sales performance by customer segment. This holistic approach enables you to uncover valuable insights and identify correlations that can drive data-driven decision-making.
Data blending also plays a significant role in scenarios where you need to analyze data that resides in different systems or departments. Rather than merging all the data together into a single data warehouse or database, data blending allows you to leverage the power of Tableau’s visual analytics capabilities without disrupting existing data structures. This makes it a versatile and efficient technique for data analysis and reporting.
Preparing Your Data for Blending – Data Source Requirements – Combining Multiple Data Sources
Before you can start blending data in Tableau, it’s important to prepare your data sources and ensure they meet certain requirements. Additionally, if you have multiple data sources that you want to blend together, you’ll need to combine them in a way that enables seamless integration. Let’s explore the steps involved in preparing your data for blending and combining multiple data sources.
Data Source Requirements
When preparing your data for blending in Tableau, there are certain requirements that your data sources must meet. These requirements ensure that Tableau can effectively blend and analyze the data. Here are some essential data source requirements:
- Data Structure: Ensure that your data sources have a consistent structure, including the same field names and data types.
- Data Granularity: Make sure that the granularity of your data sources aligns. In other words, the level of detail in your data should match across different sources.
- Data Quality: Cleanse and validate your data to eliminate duplicates, missing values, and inconsistencies. This will ensure accurate blending and analysis in Tableau.
Combining Multiple Data Sources
If you have multiple data sources that you want to blend together in Tableau, you’ll need to combine them in a way that allows for seamless integration. Here are the steps to combine multiple data sources:
- Data Source Connection: Connect to each data source separately in Tableau. This can be done using various connection options such as Excel files, CSV files, databases, or web connectors.
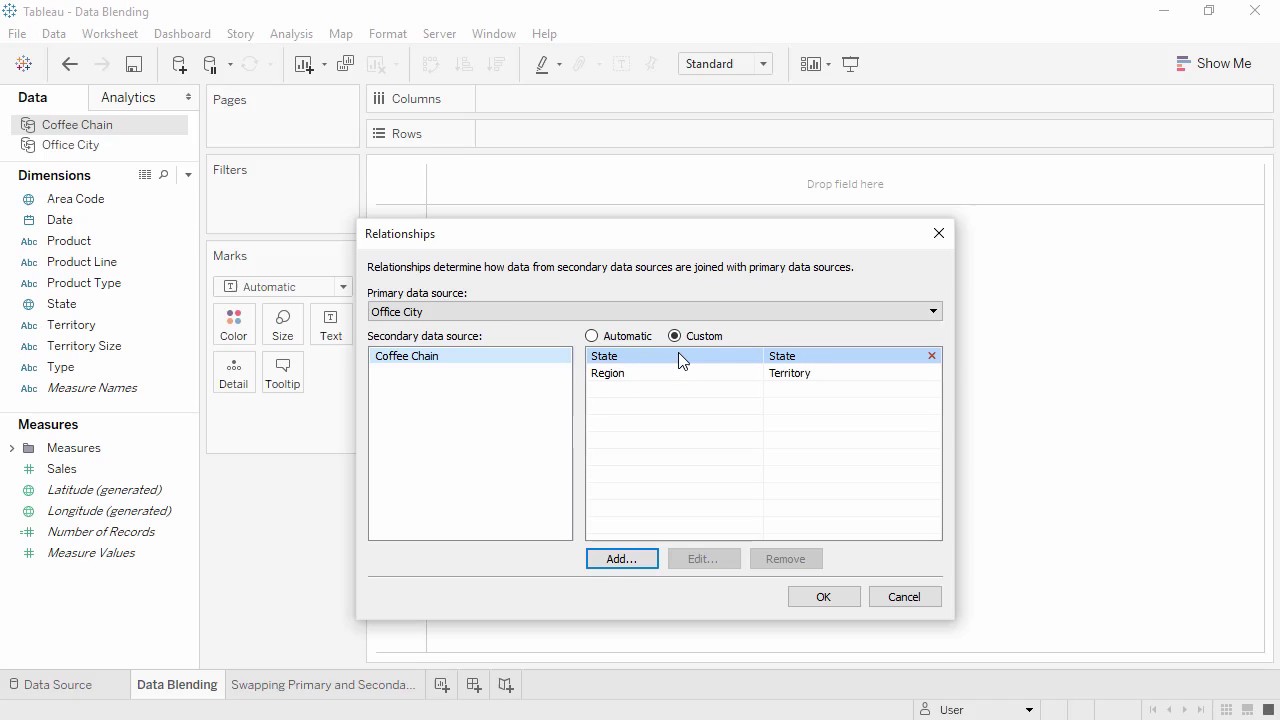
- Identify Common Fields: Look for common fields or key identifiers across the different data sources. These common fields will be used to establish relationships and blend the data together.
- Blend Methods: Tableau offers different blend methods such as inner join, left join, and right join. Choose the appropriate blend method based on your data sources and analysis requirements.
By following these steps, you can effectively prepare your data for blending and combine multiple data sources in Tableau. This will enable you to gain deeper insights and uncover valuable patterns and trends in your data.
Blending Data in Tableau- Connecting to data sources- Identifying common data fields- Applying blend methods
Blending data in Tableau allows you to combine data from multiple sources to gain deeper insights and create comprehensive visualizations. Whether you’re merging data from different databases, Excel files, or APIs, Tableau makes the process seamless and efficient. In this section, we will explore the steps involved in blending data in Tableau.
The first step in blending data is connecting to your data sources. Tableau offers a wide range of connectors, allowing you to access various data formats such as Excel, CSV, SQL databases, and cloud-based platforms like Salesforce and Google Analytics. Simply choose the appropriate connector and provide the necessary credentials to establish a connection.
Once you have connected to your data sources, the next step is to identify the common data fields that will serve as the basis for blending. These common fields act as the linking columns between the different data sources and enable Tableau to combine the data accurately. It’s essential to ensure that the common fields have a consistent data type and formatting across the sources.
After identifying the common data fields, you can apply blend methods to merge the data from different sources. Tableau offers several blend methods, including Union, Join, and Data Blending. Union combines the data vertically, concatenating the rows from multiple sources. Join combines the data horizontally, merging the data based on a specific field, such as a shared key or identifier. Data blending allows you to combine data from different sources without a predefined relationship.
When blending data in Tableau, it’s important to consider the cardinality of the data sources. Cardinality refers to the number of unique values in a field. Understanding the cardinality of your data can help you determine the appropriate blend method to use and ensure that the blending process doesn’t result in duplicated or incomplete data.
Tableau also provides flexibility in data blending by allowing you to create calculated fields. Calculated fields enable you to perform calculations or apply custom logic to the blended data. This is particularly useful when you need to derive new insights or create specific measures based on the combined data.
Tips and Best Practices for Data Blending in Tableau
Data blending in Tableau can be a powerful tool for combining multiple datasets and gaining deeper insights. However, to ensure a smooth and efficient blending process, it is important to follow some best practices. Here are some tips to consider:
Limiting the number of data sources
When blending data in Tableau, it is best to limit the number of data sources involved. Having too many data sources can make the blending process complex and difficult to manage. Try to consolidate your data sources and eliminate any unnecessary ones. This will not only simplify your analysis but also improve performance.
Handling data inconsistencies
Inevitably, when blending data from different sources, you may encounter inconsistencies in the data. It is important to identify and address these inconsistencies to ensure accurate results. Tableau provides various data cleaning and transforming capabilities, such as data type conversion, data parsing, and data aggregation. Utilize these tools to handle inconsistent data and ensure consistency across your blended dataset.
Managing performance issues
Blending large datasets or blending data from multiple sources can sometimes result in performance issues in Tableau. To mitigate these issues, consider the following strategies:
- Filter your data to reduce the amount of data being blended.
- Use data extracts to improve performance by pre-aggregating the blended data.
- Optimize your data source connections by using efficient queries or utilizing Tableau’s caching capabilities.
By implementing these performance optimization techniques, you can ensure a smooth and responsive experience while blending and analyzing your data in Tableau.
Creating calculated fields
Tableau offers a powerful feature called calculated fields that allows you to create new calculated dimensions or measures based on your blended data. Take advantage of calculated fields to perform calculations, apply custom logic, or derive new insights from your blended dataset. With calculated fields, you can further enhance your analysis and unlock hidden patterns and trends in your data.
By following these tips and best practices, you can optimize your data blending process in Tableau and gain valuable insights from your combined datasets. Remember to always test and validate your blended data to ensure accuracy and reliability in your analyses.
Conclusion
In conclusion, blending data in Tableau is a powerful technique that allows you to combine different data sources and create more comprehensive visualizations. By merging and connecting data from various files, databases, or spreadsheets, you can gain deeper insights and uncover patterns that may have been hidden otherwise. Through the use of joins, unions, and calculations, Tableau offers flexible options for blending data based on your specific requirements.
Blending data enables you to enhance your analysis, improve decision-making, and present a more holistic view of your business or project. By leveraging Tableau’s intuitive interface and robust functionality, you can seamlessly blend data and create compelling visualizations that reveal valuable information. Whether you are working with large datasets, multiple data sources, or complex business scenarios, Tableau provides the tools and capabilities to transform your data into actionable insights.
So, next time you find yourself facing the challenge of integrating and analyzing disparate datasets, remember the power of blending data in Tableau to unlock new possibilities and drive data-driven decision-making.
FAQs
1. What is Tableau?
Tableau is a powerful data visualization tool that allows you to analyze and present data in a visually appealing and interactive way. It enables users to connect to various data sources, transform raw data into meaningful insights, and create interactive dashboards and reports.
2. Why should I use Tableau for data blending?
Tableau provides a user-friendly interface and a wide range of data blending techniques that make it easy to combine data from different sources. With Tableau, you can blend data from various databases, spreadsheets, and cloud platforms to gain a comprehensive view and uncover relationships between different datasets.
3. What are the benefits of blending data in Tableau?
Blending data in Tableau offers several advantages. It allows you to bring together data from multiple sources without the need for complex SQL joins or data integration processes. This flexibility enables users to quickly analyze and visualize data from different perspectives, leading to better insights and informed decision-making.
4. How does Tableau handle data blending?
Tableau uses a technique called data blending, which allows you to combine different datasets based on common fields or dimensions. Tableau automatically identifies matching fields between datasets and creates a link between them, enabling seamless blending of the data. It also provides options to customize the blending process, such as defining relationships between fields or applying data blending hierarchies.
5. Are there any limitations to data blending in Tableau?
While data blending in Tableau is powerful, it does have certain limitations. One limitation is the performance impact when working with large datasets or complex blending scenarios. Blending data can also result in data duplication and inconsistencies if not properly managed. Additionally, some advanced analytical functions may not be available when blending data, requiring alternative approaches to achieve desired results.