
If you’re looking to harness the full power of your data and transform it into meaningful insights, Power BI is the perfect tool for you. Power BI is a business analytics service offered by Microsoft that provides interactive visualizations, real-time dashboards, and powerful data analytics capabilities. One of the key steps in leveraging Power BI is loading your data into the platform. Whether you have data stored in Excel spreadsheets, SQL databases, or other sources, this article will guide you through the process of loading data to Power BI. By understanding the steps involved and utilizing the right techniques, you’ll be able to unlock the true potential of your data and make informed business decisions. So let’s dive in and discover how to load data to Power BI.
Inside This Article
- Overview
- Step 1: Connect to a data source
- Step 2: Import data to Power BI
- Step 3: Transform and clean the data
- Step 4: Create Visualizations and Reports
- Conclusion
- FAQs
Overview
Power BI is a powerful business intelligence tool that allows you to analyze and visualize data in easy-to-understand dashboards and reports. One of the key steps in utilizing Power BI is loading data from various sources to create these visualizations. In this article, we will guide you through the process of loading data to Power BI, step by step.
Whether your data resides in spreadsheets, databases, cloud-based services, or other sources, Power BI supports a wide range of data connectors to ensure seamless integration. By connecting to your data source, you can bring in the necessary information to Power BI for analysis and visualization.
Once connected to a data source, you can import the data into Power BI. This enables you to leverage the full capabilities of Power BI, such as creating relationships between tables, performing calculations, and building interactive visualizations. The imported data will be stored within Power BI, ensuring a smooth and efficient workflow.
After importing the data, you can proceed to transform and clean it as needed. Power BI offers a range of powerful data transformation tools that allow you to shape, combine, and filter your data. This step is essential for ensuring data accuracy and reliability in your visualizations.
Once your data is transformed, you can start creating stunning visuals and reports in Power BI. With a wide range of visualization options, including charts, graphs, maps, and tables, you can effectively present your data in a meaningful and engaging way. Power BI also allows for interactive exploration, making it easy to slice and dice your data to uncover valuable insights.
Step 1: Connect to a data source
When using Power BI, the first step is to connect to a data source. This is where you will import your data from the desired source, such as a database, Excel spreadsheet, or a cloud service like Azure or Google Analytics. Power BI offers a wide range of connectors that allow you to seamlessly integrate with various data sources.
To connect to a data source in Power BI, you can follow these simple steps:
- Launch Power BI Desktop or open Power BI service.
- Click on “Get Data” from the Home menu.
- Select the appropriate data source from the available options. Power BI provides connectors for popular databases like SQL Server, Oracle, and MySQL, as well as cloud services like SharePoint, Salesforce, and Google Analytics.
- Enter the required connection details, such as server name, database name, username, and password.
- Click on “Connect” to establish a connection to the data source.
Once connected, Power BI will retrieve the metadata from the data source, allowing you to explore and analyze the data. It’s important to ensure that you have the necessary permissions and credentials to access the data source.
Connecting to a data source is a crucial step in harnessing the power of Power BI. It enables you to tap into the wealth of information stored in your data sources and start building insightful visualizations and reports.
Step 2: Import data to Power BI
Once you have connected to a data source in Power BI, the next step is to import the data into the Power BI platform. This process allows you to bring your data into Power BI so that you can analyze and visualize it effectively.
To import data to Power BI, follow these steps:
- From the Power BI interface, click on the “Get Data” button located in the Home tab. This will open a window with various data source options.
- Select the appropriate data source option based on where your data is stored. Power BI offers a wide range of options, including popular databases like SQL Server, MySQL, and Oracle, as well as cloud-based services like Excel Online, SharePoint Online, and more.
- Once you have selected the data source, click on the “Connect” button. This will prompt you to enter the necessary credentials or authentication details to establish a connection with the data source.
- After successfully connecting to the data source, you will be presented with a navigator window, which allows you to select the specific tables, queries, or files that you want to import into Power BI. You can preview the data and apply any necessary filters or transformations before importing.
- Once you have made your selections, click on the “Load” button to import the data into Power BI. Alternatively, you can choose the “Transform data” option to further refine and shape the data before loading it into Power BI.
Importing data into Power BI is a crucial step in the data analysis process. It allows you to bring in external data from various sources and consolidate it into a single, unified view. This enables you to gain valuable insights and make informed decisions based on the data.
Remember, Power BI supports a wide range of data sources, so you can import data from databases, files, cloud services, and more. This versatility gives you the flexibility to work with different types of data and ensure that you have all the information you need to create compelling visualizations and reports.
By following the import data process in Power BI, you can seamlessly integrate and analyze your data, unlocking hidden patterns and trends to drive business growth and success.
Step 3: Transform and clean the data
Once you have imported your data into Power BI, the next step is to transform and clean it to ensure accuracy and consistency. This step is essential for creating accurate visualizations and reports. Here are some key steps to follow:
1. Identify and remove any duplicate or irrelevant data: Start by reviewing your data for any duplicate rows or columns that may skew your analysis. This could be caused by data entry errors or other inconsistencies. Remove these duplicates to ensure clean and accurate data.
2. Handle missing values: Missing values can often be a challenge when working with data. Power BI offers several options to handle missing values, such as imputing the missing values with averages or removing the rows with missing values. Choose the most appropriate method based on the nature of your data and the analysis you are performing.
3. Standardize and format data: Data coming from different sources may have different formats and units. It is important to standardize the data to ensure consistency. This includes formatting dates, converting units, and ensuring uniformity across columns. Power BI provides a range of functions and tools to help you achieve this.
4. Perform calculations and derive new variables: Sometimes, you may need to perform calculations or create new variables based on the existing data. Power BI offers a powerful formula language called DAX (Data Analysis Expressions) that allows you to perform complex calculations and create calculated columns or measures.
5. Apply data transformations: Power BI offers a wide range of data transformation options, such as filtering rows, merging or appending tables, and pivoting columns. These transformations allow you to shape your data in a way that is most suitable for your analysis and visualization needs.
6. Validate and test your data: Before moving onto the next step of creating visualizations and reports, it is important to validate and test your transformed data to ensure its accuracy. Review your data to make sure it aligns with your expectations and check for any outliers or anomalies that may require further investigation.
By following these steps, you can transform and clean your data within Power BI, ensuring that it is accurate, consistent, and ready for visualization and analysis.
Step 4: Create Visualizations and Reports
After importing and transforming your data in Power BI, it’s time to unleash your creativity and bring your insights to life through visualizations and reports. This step is crucial as it enables you to effectively communicate your findings and make data-driven decisions. Here’s how you can create compelling visualizations and reports in Power BI:
1. Select the appropriate visualization: Power BI offers a wide range of visualization options such as bar charts, line charts, pie charts, and more. Choose the one that best represents your data and helps tell your story effectively.
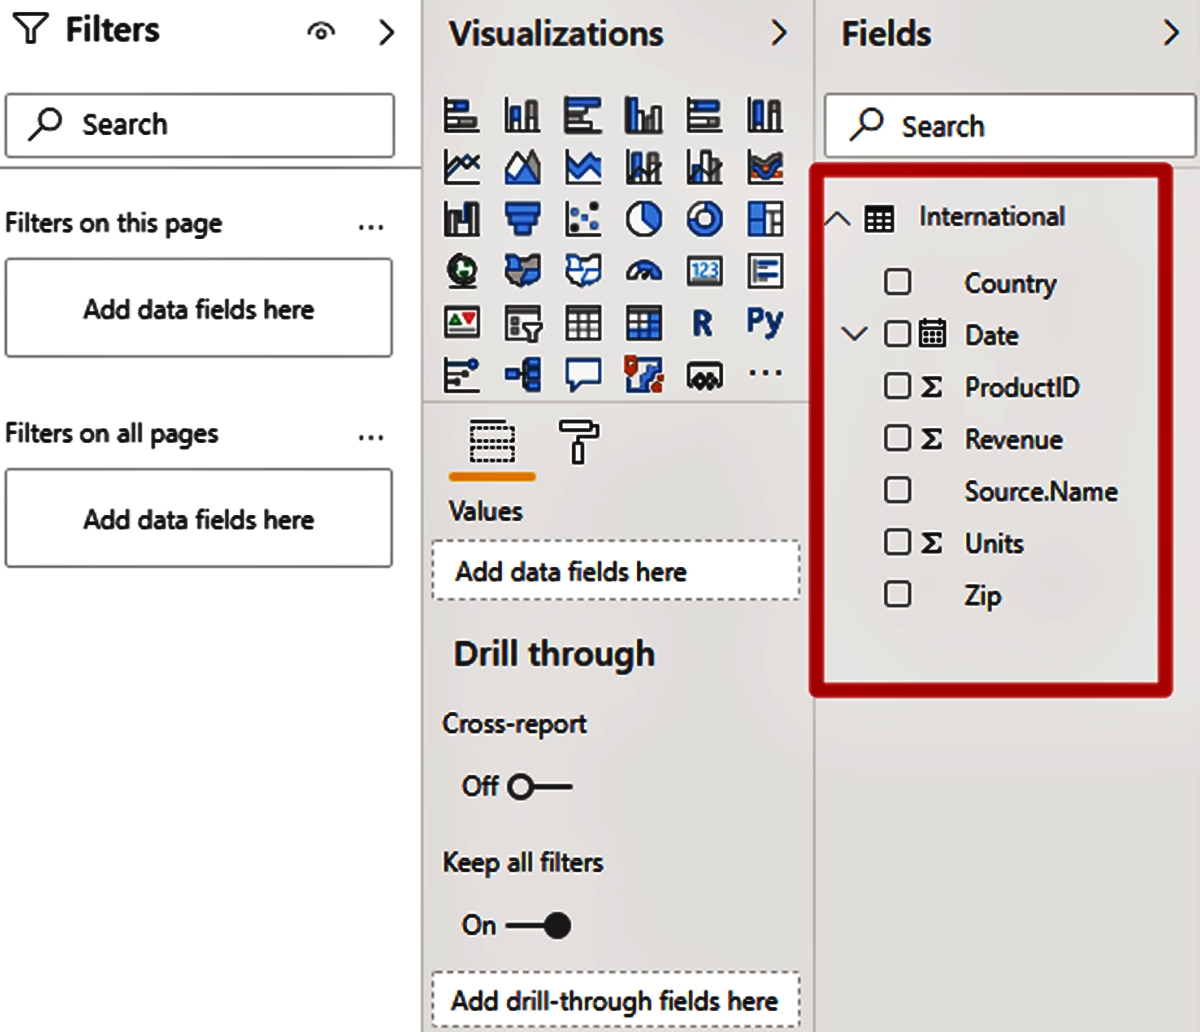
2. Drag and drop: Power BI’s intuitive interface allows you to easily drag and drop fields onto the canvas. Start by selecting the desired visualization and then add data fields to the relevant sections, such as the axis, legend, and values. Experiment with different combinations to find the most impactful representation of your data.
3. Apply filters and slicers: Power BI allows you to filter and slice your data dynamically. Use filters to focus on specific subsets of data, such as a particular time period or region. Slicers provide interactive control to slice and dice data based on different dimensions or attributes.
4. Add calculated measures and columns: If your data requires additional calculations or derived metrics, you can create calculated measures and columns within Power BI. This allows you to perform complex calculations on the fly without altering your original data source.
5. Create interactive dashboards: Power BI allows you to create visually appealing dashboards with multiple visualizations and reports. Dashboards provide a high-level overview of your data, allowing you to monitor key metrics and trends at a glance. You can also add filters and slicers to make your dashboards interactive, enabling users to explore the data on their own.
6. Format and customize: Power BI offers various formatting options to enhance the appearance of your visualizations and reports. You can customize colors, fonts, labels, and layout to align with your branding or presentation requirements. Pay attention to the aesthetics as it can significantly impact the viewer’s engagement and understanding of the data.
7. Share and collaborate: Once you have created your visualizations and reports, you can share them with others within your organization or external stakeholders. Power BI allows you to publish your dashboards and reports to the cloud, enabling real-time collaboration and access across teams. You can also control permissions to ensure data confidentiality and security.
By following these steps, you can leverage the full potential of Power BI to create insightful and visually captivating reports and dashboards. Remember to consider your audience and their specific requirements to deliver impactful data visualizations that drive informed decision-making.
Conclusion
In conclusion, loading data to Power BI is an essential step in harnessing the power of this powerful data analytics tool. By following the steps outlined in this article, you can seamlessly load your data into Power BI and unleash its full potential to gain valuable insights and make data-driven decisions.
Whether you are working with simple or complex datasets, Power BI offers a range of options and connectors to suit your needs. From importing data from local files to connecting to databases and cloud services, you have a variety of methods at your disposal.
Remember to prepare your data beforehand, verify its quality, and ensure it is in the right format to prevent any issues during the loading process. Additionally, explore the various transformation and modeling capabilities within Power BI to enhance the analysis and visualization of your data.
By mastering the art of loading data to Power BI, you can unlock actionable insights and drive better decision-making in your organization. So, get started and dive into the world of data exploration and visualization with Power BI!
FAQs
Q: What is Power BI?
Power BI is a business intelligence tool developed by Microsoft. It allows users to collect, analyze, and visualize data from various sources to gain valuable insights and make informed business decisions.
Q: How do I load data into Power BI?
To load data into Power BI, you can connect to various data sources such as databases, spreadsheets, or cloud services. You can use Power Query, a data transformation and loading tool, to clean and shape your data before loading it into Power BI.
Q: Can I load real-time data into Power BI?
Yes, Power BI supports real-time data streaming. You can connect to streaming data sources and set up refresh intervals to update your visualizations in real-time. This is useful for monitoring real-time metrics or streaming data from IoT devices.
Q: How can I schedule data refresh in Power BI?
To schedule data refresh in Power BI, you can use the Power BI service. After publishing your report to the Power BI service, you can set up a refresh schedule for your data. This ensures that your reports and visualizations stay up-to-date with the latest data.
Q: Can I collaborate with others in Power BI?
Yes, Power BI allows for collaboration and sharing of reports and dashboards. You can invite others to view or edit your reports, and even create workspaces for team collaboration. This enables seamless collaboration and sharing of insights within your organization.