
Google Docs is a convenient and versatile tool for creating and editing documents online. One of its useful features is the ability to create data tables, which are essential for organizing and visualizing information. Whether you’re creating a spreadsheet, a project plan, or a survey report, knowing how to make a data table in Google Docs can greatly enhance your workflow and presentation abilities. In this article, we will guide you through the steps to effortlessly create a data table in Google Docs. Whether you’re a beginner or an experienced user, this comprehensive guide will provide you with the knowledge and skills to create professional-looking data tables with ease. So let’s delve in and discover the various techniques to make data tables in Google Docs!
Inside This Article
- How to Make Data Table in Google Docs
- Create a New Table
- Customize Table Formatting
- Add Data to the Table
- Manipulate and Sort Data in the Table
- Conclusion
- FAQs
How to Make Data Table in Google Docs
Creating a data table in Google Docs can help you organize and visualize your data in a neat and organized manner. Whether you need to track sales figures, analyze survey responses, or simply present information in a structured format, Google Docs provides a powerful and user-friendly platform to create data tables. In this article, we will walk you through the steps of creating a data table in Google Docs and customizing its formatting to suit your needs.
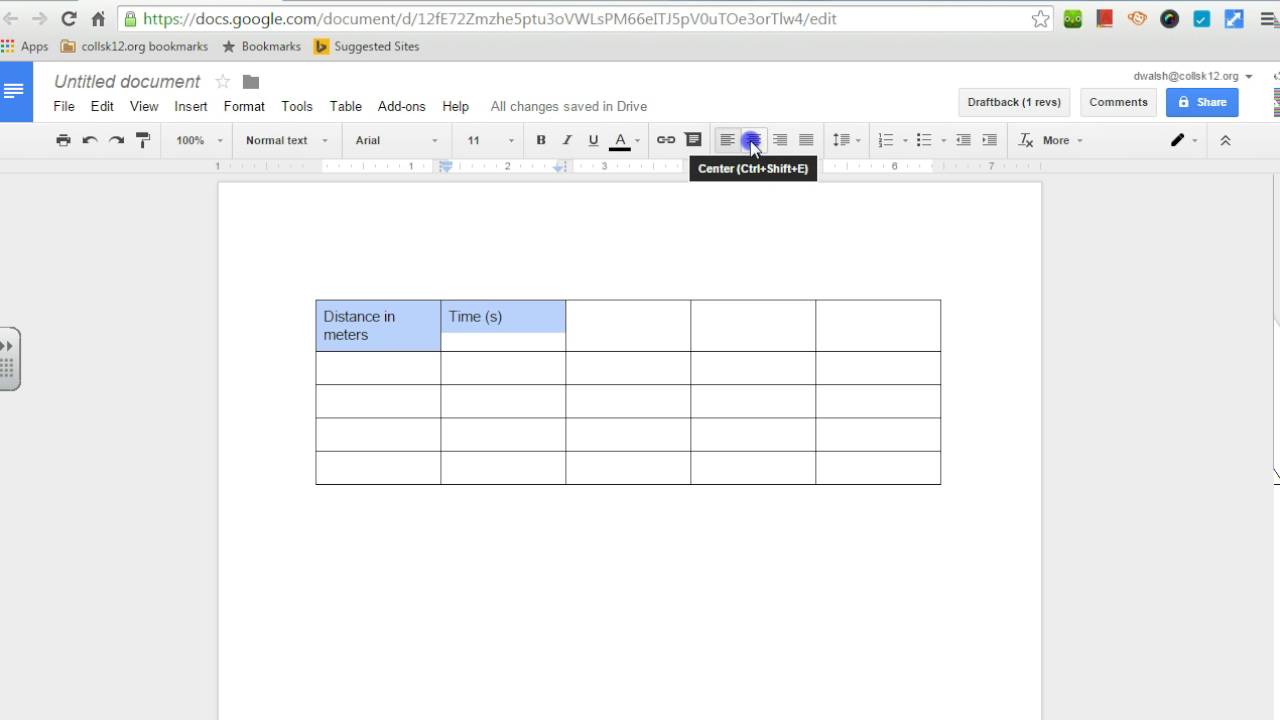
Create a New Table
The first step in creating a data table in Google Docs is to open a new or existing document. Once you have the document open, follow these steps:
- Click on the “Table” option in the top menu.
- Select “Insert table” from the drop-down menu.
- A grid appears, allowing you to specify the number of rows and columns for your table.
- Click on the desired number of rows and columns to create the initial table structure.
Voila! You have successfully created a new table in Google Docs. Now it’s time to customize the table formatting to make it visually appealing and easy to read.
Customize Table Formatting
Google Docs offers a variety of formatting options to make your data table stand out. Here are some key customization features:
- Change border color and thickness: Click on the borders of the table and select your desired color and thickness.
- Apply cell background color: Highlight the cells you want to customize and choose a color from the “Fill color” option in the top menu.
- Adjust font style and size: Select the cells or text within the table and use the font formatting options in the top menu to customize the style and size.
By applying these formatting options, you can make your data table visually appealing and easy to read.
Add Data to the Table
Now that you have created and formatted your data table, it’s time to populate it with your data. Here’s how:
- Select the cell where you want to input data.
- Type or paste your data into the cell.
- Press “Enter” to move to the next cell.
Repeat these steps for each cell in your table until you have entered all your data. You can also copy and paste data from other sources directly into your table.
Manipulate and Sort Data in the Table
Google Docs provides various tools to manipulate and sort data in your table. Here are a few helpful features:
- Resize columns and rows: Click on the borders of a column or row and drag to adjust its size.
- Sort data: Highlight the column you want to sort, click on the “Data” option in the top menu, and select “Sort sheet by column.”
- Filter data: To filter your data based on specific criteria, highlight the entire table, click on the “Data” option, and select “Create a filter.”
By utilizing these tools, you can easily manipulate and analyze your data within the Google Docs data table.
Create a New Table
Google Docs is a versatile online document editor that allows you to create tables and organize your data in a convenient manner. Whether you’re using Google Docs for work, school, or personal projects, creating a new table is a simple and straightforward process.
To create a new table in Google Docs, follow these easy steps:
- Open Google Docs and navigate to the document where you want to create the table.
- Click on the location in the document where you want the table to be inserted. This can be anywhere within the document.
- In the toolbar at the top, click on the “Table” option.
- A dropdown menu will appear with options for inserting rows and columns. Choose the desired dimensions for your table.
- The table will be inserted into your document, and you can start adding data to it.
Creating a new table in Google Docs gives you the flexibility to structure your data and organize information in a visually appealing way. Whether you need a table for brainstorming ideas, tracking project progress, or presenting data in a professional report, Google Docs has got you covered.
Customize Table Formatting
Once you have created a table in Google Docs, you can customize its formatting to make it visually appealing and easy to read. Here are some ways you can customize the table formatting:
1. Adjust Column Width
To make your table look more organized and balanced, you can adjust the width of each column. Simply place your cursor on the border of the column you want to adjust, and when the cursor changes to a double-sided arrow, click and drag it to the desired width. You can repeat this process for other columns as well.
2. Change Cell Background Color
If you want to highlight specific cells or provide color-coded information, you can change the background color of the cells. First, select the cells you want to modify by clicking and dragging over them. Then, click on the “Table” tab in the menu bar, select “Cell background color,” and choose the desired color from the palette. The selected cells will be filled with the chosen color.
3. Apply Text Formatting
To make the text within your table more readable, you can apply various text formatting options. Select the cells containing the text you want to format, and use the options in the toolbar to make changes such as bold, italicize, underline, or change the font size and color. This allows you to emphasize important information or differentiate different elements within the table.
4. Add Borders to Cells or Table
If you want to give your table a more structured appearance, you can add borders to the cells or the entire table. To add borders to specific cells, select the cells you want to modify and click on the “Table” tab in the menu bar. From there, choose the “Cell borders” option and select the type of border you want to apply. To add borders to the entire table, click outside the table to select it, go to the “Table” tab, and choose “Table borders.”
5. Merge or Split Cells
In some cases, you may need to combine multiple cells into one or divide a cell into multiple cells. To merge cells, select the cells you want to combine, right-click, and choose “Merge cells” from the context menu. This is useful for creating headings or spanning information across multiple columns. To split a cell, right-click on the cell and select “Split cell” from the context menu. This can be helpful if you want to divide a cell vertically or horizontally to accommodate more content.
By customizing the formatting of your table in Google Docs, you can present your data in a visually appealing and organized manner. Take advantage of these customization options to make your tables stand out and effectively convey information to your audience.
Add Data to the Table
Once you have created a new table in Google Docs, the next step is to start adding data to it. Adding data to a table in Google Docs is straightforward and can be done in a few simple steps.
To add data to a table, simply click on the cell where you want to enter the data and start typing. You can input text, numbers, or even formulas to perform calculations within the table. Google Docs also supports the insertion of images within table cells, which can be useful for creating visually appealing and informative tables.
If you have a large amount of data to add to the table, you can use the “Tab” key on your keyboard to move between cells and quickly enter data. This can help speed up the data entry process, especially if you are working with a complex table structure.
Google Docs also provides options to copy and paste data from other sources into the table. Simply select the data you want to copy, right-click, and choose the “Copy” option. Then, click on the target cell in the table, right-click again, and select “Paste.” This will insert the copied data into the selected cell and automatically adjust the table structure to accommodate the new data.
If you need to insert data in multiple cells at once, you can use the drag handle located at the bottom right corner of the active cell. Click and drag the handle to select the range of cells where you want to input data, and then start typing. This method is particularly useful when entering a series of numbers or dates that follow a specific pattern or sequence.
Once you have entered all the necessary data into the table, you can further customize the formatting to make it visually appealing and easy to read. Google Docs provides various formatting options such as changing font styles, adjusting cell borders, adding colors, and more. Experiment with these options to create a table that suits your needs and enhances the overall presentation of your document.
Manipulate and Sort Data in the Table
Once you have entered your data into the table in Google Docs, you can easily manipulate and sort the data to meet your specific needs. Here are some ways you can work with your data:
1. Filter Data: Google Docs offers a powerful filtering feature that allows you to narrow down your data based on specific criteria. To use this feature, click on the drop-down arrow in the header row of your table and select “Filter.” You can then choose to filter data based on certain conditions, such as values, text, or dates. This is especially useful when working with large datasets and you only want to display specific information.
2. Resize and Move Columns and Rows: To adjust the layout of your table, you can easily resize and move columns and rows in Google Docs. Simply hover your mouse over the border between two columns or rows until the cursor turns into a double-headed arrow, then click and drag to resize. To move a column or row, click on the header cell and drag it to the desired location.
3. Calculate Totals: If your table contains numerical data, you can use formulas in Google Docs to perform calculations and display totals. To insert a formula, click on an empty cell where you want the result to appear and type “=” followed by the formula. For example, “=SUM(A2:A5)” will calculate the sum of the values in cells A2 to A5. Google Docs supports a variety of functions, such as SUM, AVERAGE, MAX, MIN, and more.
4. Sort Data: Sorting your data in Google Docs can help you organize it in a meaningful way. To sort a column in ascending or descending order, click on the header cell of the column and then click on the “Sort A to Z” or “Sort Z to A” button in the toolbar. You can also sort by multiple columns by holding the Shift key while selecting the columns, and then clicking on the sort button.
5. Freeze Rows and Columns: When working with large tables, it can be helpful to keep certain rows or columns visible at all times. Google Docs allows you to freeze rows and columns so that they remain in place even when scrolling through the rest of the table. To freeze rows or columns, click on the “View” menu, select “Freeze,” and choose the option that suits your needs.
With these features, manipulating and sorting data in the table becomes a breeze. Google Docs provides a powerful and flexible tool for handling data, whether you need to filter, calculate, or reorganize your information. Take advantage of these options to make your data table in Google Docs more precise and efficient.
Conclusion
In conclusion, creating a data table in Google Docs is a simple and efficient way to organize and present data in a visually appealing manner. By following the steps outlined in this guide, you can easily create a structured and professional-looking table that meets your specific needs.
With the flexibility of customizing colors, fonts, and styles, you can easily match the table to your document’s overall design aesthetic. Additionally, the collaboration features of Google Docs allow you to work seamlessly with others, making it an ideal choice for team projects and presentations.
Whether you’re using Google Docs for work, school, or personal use, mastering the art of creating data tables will undoubtedly prove to be a valuable skill. So, start experimenting with different table formats, explore advanced features such as formulas and conditional formatting, and unlock the full potential of data organization in Google Docs.
Create eye-catching tables, showcase your data effectively, and take your document presentations to the next level with Google Docs’ powerful table creation capabilities.
FAQs
1. Can I create a data table in Google Docs?
Yes, you can create a data table in Google Docs. Google Docs provides a feature called “Tables” that allows you to easily create and format tables to display data. You can input your data, customize the appearance of the table, and even perform basic calculations using formulas within the table.
2. How do I create a data table in Google Docs?
To create a data table in Google Docs, follow these steps:
- Open a new or existing document in Google Docs.
- Click on the “Table” tab in the top menu.
- Select “Insert table” from the drop-down menu.
- Choose the number of rows and columns you want for your table.
- Click to insert the table into your document.
- Input your data into the cells of the table and format it as needed.
3. Can I format the data table in Google Docs?
Absolutely! Google Docs offers various formatting options to customize the appearance of your data table. You can change the font style, font size, cell colors, borders, alignment, and other visual aspects. You can also apply formulas to perform calculations, sort data, and apply conditional formatting to highlight specific cells based on conditions.
4. Can I import data into a Google Docs data table?
Yes, you can import data into a Google Docs data table. If you have data in a spreadsheet or a CSV file, you can easily import it into your document by copying and pasting the data or using the “Insert” > “Table” > “Insert table using data from another source” option. This allows you to bring in data from external sources and automatically populate the table in Google Docs.
5. Can I collaborate on a data table in Google Docs?
Yes, collaboration is one of the key features of Google Docs. You can share your data table with others and collaborate in real time. Multiple users can simultaneously edit the table, make changes, add comments, and track revisions. This makes it easy to work on a data table as a team, whether it’s for a project, data analysis, or any collaborative work.