
Are you struggling with normalizing data in Excel? No need to worry, as we’ve got you covered! Normalizing data is a crucial step in data analysis, as it allows you to organize and standardize your data for better insights. Whether you’re an Excel newbie or an experienced user, this article will guide you through the process of normalizing data and provide you with useful tips and tricks to make your work easier. From understanding the concept of data normalization to implementing it using various techniques in Excel, you’ll gain the knowledge and skills needed to effectively handle your data. So, let’s dive in and learn how to normalize data in Excel like a pro!
Inside This Article
- Overview
- Step 1: Identify the Data
- Step 2: Remove Duplicates
- Step 3: Handle Missing Values
- Step 4: Standardize Unit of Measurement
- Step 5: Normalize Data Using Formulas
- Step 6: Normalize Data with Excel Functions
- Step 7: Validate and Verify Normalize Data
- Conclusion
- FAQs
Overview
In data analysis, it is often essential to normalize data to ensure consistency and comparability. Normalizing data in Excel involves transforming the data so that it adheres to a standard format or scale. This process allows for more accurate analysis and meaningful insights. In this article, we will explore the steps to normalize data in Excel, from identifying the data to validating and verifying the normalized results.
By normalizing data, you can eliminate redundancies, handle missing values, and standardize units of measurement. This ensures that all the data in your Excel spreadsheet is consistent and comparable, making it easier to perform calculations and analyze trends. Whether you are working with financial data, sales figures, or any other type of data, normalizing it can improve the accuracy and reliability of your analysis.
Normalization is particularly useful when dealing with large datasets that contain duplicate entries. By removing duplicates, you can ensure that each piece of data is unique and accurate. Additionally, handling missing values is crucial for accurate analysis. Normalization methods can help fill in missing data or provide estimates to ensure the completeness of your dataset.
Another important aspect of normalizing data is standardizing the unit of measurement. This step ensures that all values in your dataset are expressed in the same units, making it easier to compare and analyze the data. Standardization also eliminates any biases that may arise due to variations in the way the data is measured or recorded.
Excel provides various tools and functions to assist in the normalization process. By using formulas, you can apply mathematical operations to transform the data and bring it to a standard scale. Excel functions such as MIN, MAX, AVERAGE, and STDEV can also be used to calculate normalized values. These tools make the process of normalizing data more efficient and less time-consuming.
Lastly, it is crucial to validate and verify the normalized data. After completing the normalization steps, it is important to ensure that the results are accurate and reliable. You can do this by cross-checking the normalized data with the original dataset or performing additional calculations to confirm the accuracy of the normalized values.
Step 1: Identify the Data
Before normalizing data in Excel, the first step is to identify the data that needs to be normalized. Take a close look at your dataset and consider the following aspects:
- Identify the variables: Determine the different types of data present in your dataset. This could include numerical data, categorical data, dates, or textual information.
- Understand the data structure: Determine the structure of your data. Is it organized in a single column or multiple columns? Are there any missing values or duplicates?
- Identify the data ranges: Determine the range of data that needs to be normalized. This will help you focus your efforts on the specific data that requires normalization.
By understanding the nature of your data and its structure, you can proceed with the next steps of the normalization process more effectively.
Step 2: Remove Duplicates
In the process of normalizing data in Excel, it is crucial to identify and remove duplicate entries. Duplicate data can skew your analysis and lead to inaccurate results. Fortunately, Excel provides an easy-to-use feature to help you identify and eliminate duplicates quickly.
To remove duplicates in Excel, follow these steps:
- Select the range of data that you want to check for duplicates. This can be a column, row, or entire dataset.
- Click on the “Data” tab in the Excel toolbar.
- Within the “Data Tools” group, click on the “Remove Duplicates” button.
- A dialog box will appear, prompting you to select the columns that you want to check for duplicates. Ensure the correct columns are selected.
- You have the option to choose whether to remove duplicates based on all columns or only specific columns. Make your selection based on your specific needs.
- Click on the “OK” button to remove the duplicate entries.
After following these steps, Excel will remove all duplicate entries, leaving you with a dataset that contains only unique values. This is an essential step in the data normalization process as it ensures that each data point is represented accurately and prevents any duplication in your analysis.
Removing duplicates not only helps in normalizing the data but also in maintaining data integrity. By eliminating duplicates, you can avoid double-counting or overemphasizing certain values, which can significantly impact the accuracy of your analysis.
Remember, regularly checking for and removing duplicates is a good practice to maintain clean and reliable data sets in Excel. Incorporating this step in your data normalization process will enhance the quality and accuracy of your data analysis.
Step 3: Handle Missing Values
Missing values can greatly affect the accuracy and reliability of your data analysis. In Excel, there are several methods you can use to handle missing values and ensure that your data is complete and meaningful. Here are some effective strategies:
1. Identify missing values: First, you need to identify which cells contain missing values. In Excel, missing values are often represented as blank cells or cells with the value “NA” or “NaN.” Use filters or sorting techniques to easily locate these cells.
2. Delete rows or columns: If the missing values are scattered throughout your spreadsheet and do not form a pattern, one way to handle them is to simply delete the rows or columns that contain missing values. However, use this method cautiously as it can result in data loss.
3. Fill in missing values with estimated data: Another option is to estimate missing values based on the available data. For example, if you have a time series dataset, you can use interpolation techniques to fill in missing values based on the trends and patterns in the data.
4. Replace missing values with the mean or median: If your dataset contains numerical values, you can replace the missing values with the mean or median of the corresponding column. This method helps maintain the overall distribution of the data and avoids introducing bias.
5. Use conditional logic: Excel’s conditional formatting feature allows you to apply logical rules to your data. You can set a condition that checks for missing values and apply a formatting style to highlight them. This makes it easier to visually identify and handle missing values.
6. Utilize Excel functions: Excel provides functions that can help you handle missing values efficiently. For example, the IF function can be used to replace missing values with specified values based on a condition. The ISNA function helps identify cells containing the “NA” value.
7. Consider advanced techniques: If you have a large dataset with complex patterns of missing values, you may need to explore more advanced techniques. Imputation methods, such as regression imputation or multiple imputation, can help fill in missing values based on the relationships among variables.
Remember, the approach you choose to handle missing values depends on the nature of your data and the purpose of your analysis. It’s important to assess the impact of handling missing values and ensure that the chosen method aligns with the goals of your analysis.
Step 4: Standardize Unit of Measurement
When working with data in Excel, it is crucial to ensure that the units of measurement are standardized. This step is essential because different units of measurement can create inconsistencies and inaccuracies in your analysis. Standardizing the units will allow you to compare and analyze the data accurately.
The first step in standardizing units is to identify the units of measurement used in your data. Look for any labels or symbols that indicate the unit, such as “kg” for kilograms or “cm” for centimeters. Make a note of these units as you will need them to convert the data.
Next, determine the desired unit of measurement that you want to use throughout your analysis. For example, if your data includes weights in pounds and you want to convert them to kilograms, you would choose “kg” as the desired unit.
To standardize the units, you will need to apply conversion formulas. Excel provides a wide range of built-in conversion functions that can help you with this task. For example, if you want to convert pounds to kilograms, you can use the CONVERT function in Excel.
To use the CONVERT function, you need to specify the value you want to convert, the current unit, and the desired unit. Excel will then perform the conversion for you. For example, if you have a weight value in cell A1 and you want to convert it from pounds to kilograms, you can use the formula:
=CONVERT(A1, "lbm", "kg")
This formula will convert the value in cell A1 from pounds to kilograms. You can apply this formula to the entire column or range of values to convert them all at once.
Alternatively, if you need to convert units that don’t have a specific Excel function, you can create your own conversion formulas. For example, if you want to convert inches to centimeters, you can use the formula:
=A1 * 2.54
This formula multiplies the value in cell A1 by 2.54 to convert inches to centimeters. Again, you can apply this formula to multiple cells or a range of values to standardize the units.
After applying the conversion formulas, make sure to review and validate the converted values. Double-check the results to ensure that the units are consistent and accurate throughout your data.
Standardizing units of measurement is a critical step in the data normalization process. By ensuring that all the data is expressed in the same unit, you can eliminate inconsistencies and facilitate meaningful analysis. Take the time to standardize the units in your Excel data to ensure the accuracy and reliability of your analysis.
Step 5: Normalize Data Using Formulas
When it comes to normalizing data in Excel, one effective approach is to use formulas. By applying mathematical calculations, you can manipulate the data and bring it into a consistent format. Here are some commonly used formulas for data normalization:
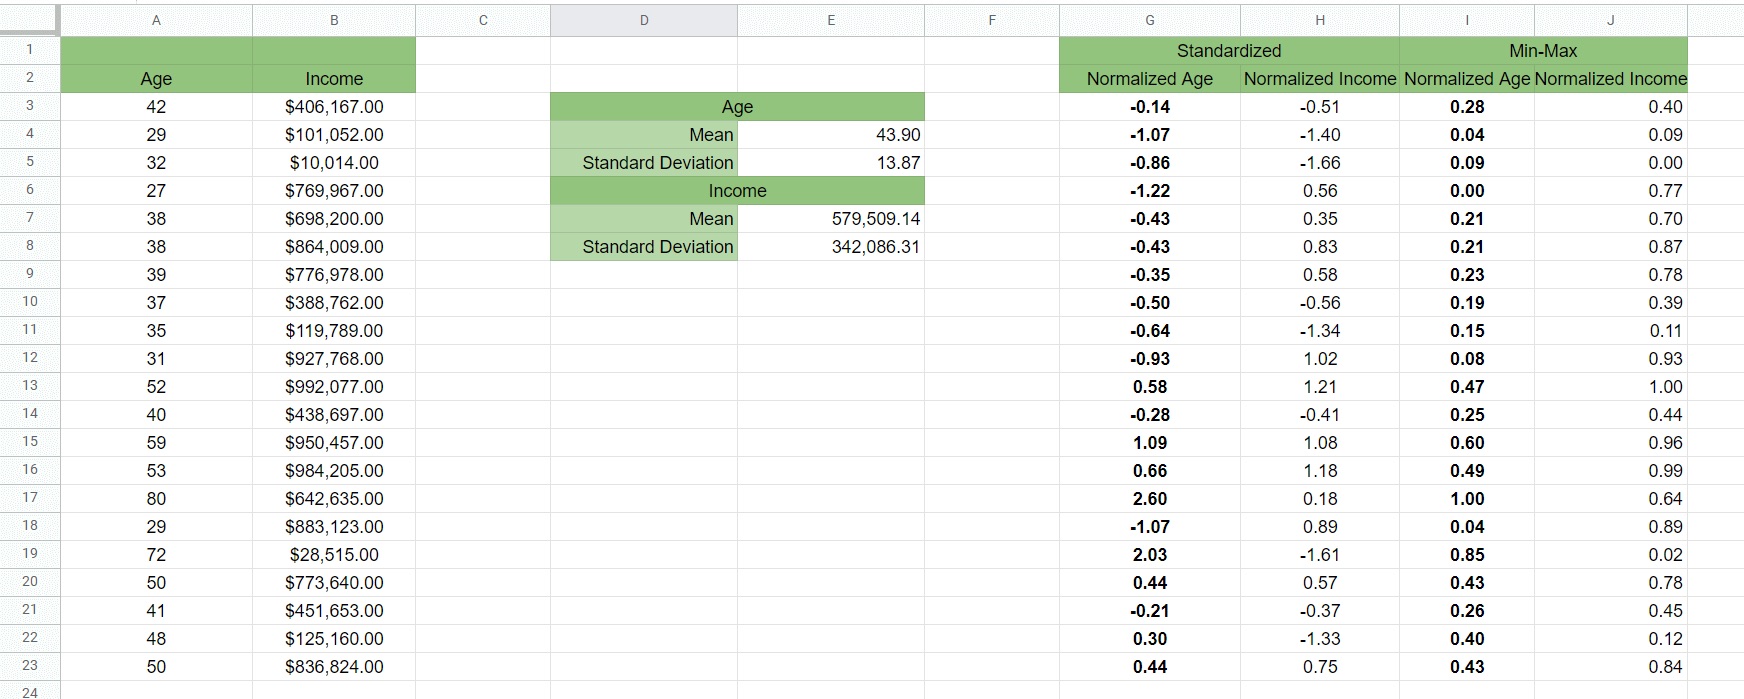
1. Min-Max Scaling: This formula rescales the data between a specified range. To apply Min-Max scaling, use the following formula:
= (x - min) / (max - min)
Where x is the original data point, min is the minimum value in the data set, and max is the maximum value. This formula will transform the data into a range between 0 and 1.
2. Z-Score Transformation: Z-Score transformation is used to standardize data by converting it into a distribution with a mean of 0 and a standard deviation of 1. To apply Z-Score transformation, use the following formula:
= (x - mean) / standard deviation
The mean and standard deviation can be calculated using Excel functions such as AVERAGE and STDEV.
3. Decimal Scaling: Decimal scaling is a method where the decimal point is moved to the left or right based on the value’s magnitude. The number of decimal places to move depends on the maximum absolute value in the data set. To apply decimal scaling, use the following formula:
= x / (10 ^ n)
Where x is the original data point and n is the number of decimal places to move. This formula will normalize the data to have values between -1 and 1.
4. Log Transformation: Log transformation is used when the data is heavily skewed towards one end. By taking the logarithm of the data, you can compress the values and make the distribution more symmetric. To apply log transformation, use the following formula:
= LOG(x)
Where x is the original data point. This formula will normalize the data by taking the natural logarithm of each value.
These are just a few examples of formulas you can use to normalize data in Excel. Depending on the nature of your data and the desired normalization method, you can explore other formulas or even create custom formulas to meet your specific needs.
By applying these formulas, you can transform your data into a standardized format, enabling easier comparisons and analysis. However, it’s important to choose the appropriate normalization method based on the characteristics of your data and the requirements of your analysis.
Step 6: Normalize Data with Excel Functions
When it comes to normalizing data in Excel, one of the most efficient ways is to use Excel functions. These functions are specifically designed to perform calculations and manipulations on data within Excel. By leveraging these functions, you can quickly and accurately normalize your data for further analysis.
Here are a few commonly used Excel functions that can help you normalize your data:
- AVERAGE: This function calculates the average of a set of numbers. It is useful when you want to normalize data based on the mean value.
- STDEV: The STDEV function calculates the standard deviation of a set of numbers. It helps you determine the spread or variability of data, which can be valuable when normalizing based on standard deviations.
- MAX and MIN: These functions return the maximum and minimum values in a range of data. They are useful for normalizing data within a specific range.
- NORM.S.DIST: This function calculates the cumulative distribution function of a specified value in a standard normal distribution. It can be used when you want to normalize data using z-scores.
To normalize data using these functions, you need to understand their syntax and how they operate. Here’s a step-by-step process to help you get started:
- Identify the data range that needs to be normalized.
- Select the cell where you want to display the normalized data.
- Choose the appropriate Excel function based on your normalization method.
- Input the necessary arguments or references within the function.
- Press Enter to instantly calculate and display the normalized value.
It’s important to note that while Excel functions can automate the normalization process, it’s crucial to understand the underlying concepts and techniques to ensure accurate and meaningful results.
Also, keep in mind that there are many other specialized Excel functions available depending on your specific data normalization requirements. Exploring Excel’s functions library and conducting further research can help you discover additional tools and techniques to effectively normalize your data.
By harnessing the power of Excel functions, you can streamline the normalization process and save time and effort when working with large datasets. Take some time to familiarize yourself with these functions, and you’ll be well-equipped to tackle data normalization in Excel.
Step 7: Validate and Verify Normalize Data
In the final step of the data normalization process, it is crucial to validate and verify the accuracy of the normalized data. This step helps ensure that the data is correctly transformed and ready for analysis. Let’s explore some essential practices for validating and verifying normalized data in Excel.
1. Data Consistency: Check for any inconsistencies or discrepancies within the normalized data. Look for any outliers or anomalies that might indicate errors in the normalization process. Cross-reference the data with the original dataset to ensure that all values are accurately represented.
2. Data Integrity: Verify the integrity of the normalized data by performing data quality checks. This involves examining the data for completeness, correctness, and accuracy. Look for any missing values, incorrect formatting, or data entry errors that might affect the validity of the normalized data.
3. Data Relationships: Validate the relationships between the normalized data and other related datasets. Ensure that the data dependencies and connections are maintained during the normalization process. This helps to maintain data integrity and consistency throughout the analysis.
4. Check Calculation Formulas: Review the formulas used to normalize the data. Make sure that the formulas are correct and accurately represent the normalization rules and principles. Double-check any calculations or transformations made to ensure the accuracy of the normalized data.
5. Data Validation: Utilize Excel’s data validation feature to set rules and constraints on the normalized data. This helps prevent any invalid or inconsistent data from entering the dataset. Define validation criteria such as data ranges, allowed values, or specific formatting requirements to ensure data accuracy and integrity.
6. Visual Inspection: Take a visual approach to validate the normalized data. Scan through the dataset, looking for any obvious errors or inconsistencies. Use conditional formatting or visual cues to highlight any potential issues, such as duplicated values or outliers.
7. Sensitivity Analysis: Perform sensitivity analysis on the normalized data to evaluate the impact of variations or changes in the data. This helps identify any potential weaknesses or vulnerabilities within the normalization process and allows for fine-tuning the data transformation if necessary.
By following these steps, you can thoroughly validate and verify the accuracy and integrity of your normalized data in Excel. This ensures that the data is reliable and ready for analysis, enabling you to make confident and informed decisions based on the normalized data.
In conclusion, normalizing data in Excel is a crucial step in data analysis. By normalizing the data, you can remove redundancies and inconsistencies, allowing for accurate and meaningful analysis. By understanding the normalization process and utilizing the various techniques such as splitting data into separate tables, creating relationships, and using lookup functions, you can effectively organize and structure your data for better insights.
Whether you are dealing with large datasets or smaller sets of information, normalizing the data will help you improve data integrity, reduce data redundancy, and enhance data analysis efficiency. Remember to follow the normalization guidelines and establish appropriate relationships between tables to ensure optimal data structure.
Overall, leveraging the power of Excel’s built-in features for data normalization can greatly enhance your ability to analyze and interpret data accurately. So, start applying the normalization techniques discussed in this article to gain a deeper understanding of your data and make more informed decisions.
FAQs
1. What is data normalization in Excel?
Data normalization in Excel is the process of organizing and structuring data in a consistent and standardized format. It involves removing redundant data, eliminating data duplication, and ensuring that each data entry is unique and properly categorized. By normalizing data, you can improve data quality, reduce data redundancy, and make it easier to analyze and manipulate data in Excel.
2. Why is data normalization important in Excel?
Data normalization is important in Excel because it enhances data integrity and accuracy. It allows for efficient data storage, retrieval, and analysis. Normalized data eliminates inconsistencies, reduces data redundancy, and provides a solid foundation for data manipulation and reporting. By normalizing data in Excel, you can ensure that your data is well-organized, consistent, and reliable.
3. What are the benefits of normalizing data in Excel?
The benefits of normalizing data in Excel include:
- Improved data integrity and accuracy
- Reduced data redundancy
- Enhanced data organization and structure
- Easier data analysis and reporting
- Increased data consistency
- Efficient data storage and retrieval
4. How do I normalize data in Excel?
To normalize data in Excel, you can follow these steps:
- Identify the tables and entities in your data.
- Split data into different tables based on their entities.
- Assign primary keys to each table to ensure uniqueness.
- Create relationships between the tables using foreign keys.
- Eliminate data redundancy by removing duplicate data.
- Normalize each table by breaking down data into smaller, atomic units.
- Organize the tables in a logical and standardized format.
- Verify data integrity and consistency after normalization.
5. Are there any limitations or considerations when normalizing data in Excel?
When normalizing data in Excel, there are a few limitations and considerations to keep in mind:
- Normalization can increase the complexity of data retrieval and analysis.
- Normalization might not be necessary for small datasets or simple data structures.
- Normalization requires careful planning and understanding of the data relationships.
- Normalization may not be suitable for all types of data, such as textual data or free-form data.
- Normalization can result in more complex database queries and joins.