
Are you looking to normalize data in Excel? Well, you’ve come to the right place! Normalizing data is an important step in data analysis that ensures consistency and accuracy in your spreadsheets.
But what exactly does it mean to normalize data in Excel? Simply put, normalization is the process of organizing data in a way that minimizes redundancy and maximizes efficiency. It involves breaking down complex data sets into smaller, more manageable units, making it easier to analyze and draw conclusions.
In this article, we will explore various methods to normalize data in Excel, providing you with step-by-step instructions and useful tips along the way. Whether you’re a beginner or an experienced Excel user, this comprehensive guide will help you make sense of your data and unleash the full potential of Excel’s analytical capabilities.
Inside This Article
- Overview
- Step 1: Identify the data range
- Step 2: Calculate the mean and standard deviation
- Step 3: Normalize the data using the z-score
- Step 4: Normalize the data using min-max scaling
- Summary
- Conclusion
- FAQs
Overview
Normalizing data in Excel is a process that allows you to scale and transform your data to a common scale or range. This is particularly useful when working with datasets that have varying scales or units, as it allows for easier comparison and analysis between different variables. In this article, we will explore how to normalize data in Excel using two common methods: the z-score and min-max scaling.
Normalizing data helps to eliminate any potential biases that may arise from differences in units or scales. By standardizing the data, you can ensure that each value is comparable to others in the dataset. This process is especially crucial in fields like statistics, machine learning, and data analysis, where accurate comparisons and interpretation of data are essential.
Normalizing data using the z-score involves calculating the mean and standard deviation of the dataset. The z-score formula then transforms each value by subtracting the mean and dividing it by the standard deviation. This method adjusts the data distribution to have a mean of 0 and a standard deviation of 1, effectively standardizing the values.
The other method, min-max scaling, rescales the data to a specified range, typically between 0 and 1. This is achieved by subtracting the minimum value from each data point and dividing it by the range of the dataset. This normalization technique preserves the relative relationships between the values and brings them to a common scale.
Both normalization methods have their advantages and can be used depending on the specific requirements of your analysis. The z-score is beneficial when you need to identify extreme values or outliers, as they will have z-scores significantly higher or lower than the mean. On the other hand, min-max scaling is useful when you want to maintain the original distribution of the data.
In the subsequent sections, we will walk through each step of the normalization process in Excel, providing clear instructions and examples. By the end of this article, you will have a solid understanding of how to normalize data in Excel and be ready to apply these techniques to your own datasets.
Step 1: Identify the data range
Before we can begin normalizing data in Excel, it is important to first identify the range of data that needs to be normalized. This range refers to the set of values that you want to adjust to a common scale. It could be a column of numbers representing sales figures, temperature readings, or any other type of data that you want to normalize.
To identify the data range, open your Excel spreadsheet and select the cells containing the data you want to normalize. Make sure to include any header cells if applicable, as they provide important context for the data. You can use your mouse to highlight the range or by clicking and dragging, or you can manually enter the cell range in the formula bar at the top of the Excel window.
Once you have selected the data range, it’s a good idea to double-check that you have accurately included all the necessary cells. This will ensure that the normalization process applies to the correct data set.
Step 2: Calculate the mean and standard deviation
Calculating the mean and standard deviation of a dataset is an essential step in normalizing the data in Excel. The mean represents the average value of the dataset, while the standard deviation measures the spread or variability of the data points around the mean.
To calculate the mean, you can use the AVERAGE function in Excel. This function takes a range of cells as input and returns the arithmetic mean of those values. For example, if your data is in cells A1 to A10, you can use the formula:
=AVERAGE(A1:A10)
This will give you the mean value of the dataset.
The standard deviation can be calculated using the STDEV function in Excel. Similar to the AVERAGE function, the STDEV function takes a range of cells as input and returns the standard deviation of those values. For example:
=STDEV(A1:A10)
This formula will compute the standard deviation of the dataset.
It’s important to note that the mean and standard deviation provide valuable insights into the distribution of the dataset. The mean gives you the central tendency, while the standard deviation indicates how the data points deviate from this average. These statistics play a crucial role in normalizing the data in the subsequent steps.
Step 3: Normalize the data using the z-score
Normalizing data is an essential step in data analysis as it allows you to compare variables on a common scale and eliminate the influence of differences in the original data distributions. One popular method for normalization is using the z-score. The z-score measures how many standard deviations an individual data point is away from the mean of the dataset. In this step, we will walk you through the process of normalizing your data using the z-score.
To normalize data using the z-score, you need to follow these steps:
- Calculate the mean of the dataset.
- Calculate the standard deviation of the dataset.
- Subtract the mean from each data point in the dataset.
- Divide the difference by the standard deviation.
Let’s dive into each step in detail.
1. Calculate the mean of the dataset: The mean represents the average value of the dataset. To calculate the mean, add up all the values in the dataset and divide the sum by the number of data points. For example, if you have a dataset with values [10, 12, 14, 16, 18], the mean would be (10+12+14+16+18)/5 = 14.
2. Calculate the standard deviation of the dataset: The standard deviation measures the variability or spread of the dataset. It tells us how much the data points deviate from the mean. To calculate the standard deviation, follow these steps:
- Subtract the mean from each data point.
- Square the difference obtained in the previous step.
- Calculate the mean of the squared differences.
- Take the square root of the mean obtained in the previous step.
3. Subtract the mean from each data point in the dataset: This step involves subtracting the mean value from each individual data point in the dataset. This operation centers the data around zero.
4. Divide the difference by the standard deviation: Finally, divide the difference obtained in step 3 by the standard deviation calculated in step 2. This will scale the data and give it a mean of 0 and a standard deviation of 1.
After following these steps, you will have successfully normalized your data using the z-score. Normalized data allows for easier comparison and analysis, as it removes the influence of different scales and distributions in the original dataset.
Continue to the next step to learn about another method of normalization: min-max scaling.
Step 4: Normalize the data using min-max scaling
In data analysis, normalizing data is crucial to ensure that the range of values across different variables is comparable. One popular method for normalizing data is called min-max scaling. This technique scales the data to a specific range (usually between 0 and 1) by subtracting the minimum value and dividing by the range.
To normalize your data using min-max scaling in Excel, follow these steps:
- Select the range of data you want to normalize.
- Find the minimum value and the maximum value in your selected range. You can use Excel’s MIN and MAX functions to do this easily.
- Subtract the minimum value from each data point in the range.
- Divide each data point by the range (the difference between the maximum and minimum values).
Let’s walk through an example to illustrate how to apply min-max scaling in Excel:
Suppose you have a column of data representing the weights of apples, ranging from 100 grams to 200 grams. You want to normalize this data using min-max scaling.
Step 1: Select the range of weights, from cell A2 to A11.
Step 2: Use the MIN and MAX functions to find the minimum and maximum values of the selected range. Assuming cell B2 contains the formula =MIN(A2:A11), and cell B3 contains the formula =MAX(A2:A11).
Step 3: In an empty column, subtract the minimum value (B2) from each weight value. For example, if you choose column C, write the formula =A2-$B$2 in cell C2 and drag it down to apply the formula to the entire range of weights.
Step 4: In the next column, divide each normalized weight (in column C) by the range of weights (B3 – B2). For example, if you choose column D, write the formula =C2/($B$3-$B$2) in cell D2 and drag it down to apply the formula to the remaining normalized weights.
After completing these steps, you will have a new column with the normalized weights that range between 0 and 1, with 0 representing the minimum weight and 1 representing the maximum weight.
Normalizing data using min-max scaling can be particularly useful when comparing variables with different units or ranges. By scaling the data to a common range, you can easily identify patterns or anomalies across different variables.
That’s it! You have successfully normalized your data using min-max scaling in Excel.
Summary
In this article, we discussed the steps to normalize data in Excel. Normalizing data is crucial when working with datasets that have different scales or units of measurement. By normalizing the data, we can bring it to a common scale, making comparisons and analysis more accurate and meaningful.
We started by identifying the data range we wanted to normalize. Then, we calculated the mean and standard deviation of the data. These statistical measures gave us insights into the distribution of the data and helped us understand its variability.
Next, we applied the z-score method to normalize the data. This involved subtracting the mean from each data point and dividing it by the standard deviation. The resulting normalized data had a mean of 0 and a standard deviation of 1. This method is useful when we want to preserve the distribution shape of the original data.
We also discussed the min-max scaling method, which rescales the data to a predefined range, typically between 0 and 1. This method is helpful when we want to map the data to a specific range or when the original distribution shape is not essential.
By following these steps, you can effectively normalize data in Excel and unlock its full potential for analysis and interpretation. Keep in mind that the choice of normalization method depends on the specific requirements of your analysis and the nature of the data.
So, whether you are working with financial data, survey results, or any other dataset, normalizing your data will ensure accurate and meaningful insights. With Excel’s powerful data manipulation capabilities, you can easily transform your data and make it ready for further analysis or visualization.
Now that you have learned how to normalize data in Excel, you can apply this knowledge to enhance your data analysis projects and make informed decisions based on solid, standardized data.
The process of normalizing data in Excel is a crucial step in data analysis. By organizing and standardizing data, we can ensure accuracy and make it easier to perform calculations and comparisons. Whether we are working with financial data, sales figures, or any other type of data set, the normalization process allows us to eliminate redundancies, reduce errors, and create a consistent format for analysis.
Excel provides various tools and techniques to normalize data, such as splitting cells, removing duplicates, and using functions like TRIM and CONCATENATE. These functions, combined with sorting and filtering, enable us to clean and structure data efficiently. Additionally, pivot tables and charts can be used to summarize and visualize normalized data, providing insights for decision-making.
Overall, mastering the art of normalizing data in Excel is a valuable skill for anyone working with large data sets, as it promotes accuracy, efficiency, and better decision-making. By following the guidelines and techniques outlined in this article, you can ensure that your data is well-organized and ready for analysis.
FAQs
1. What is data normalization in Excel?
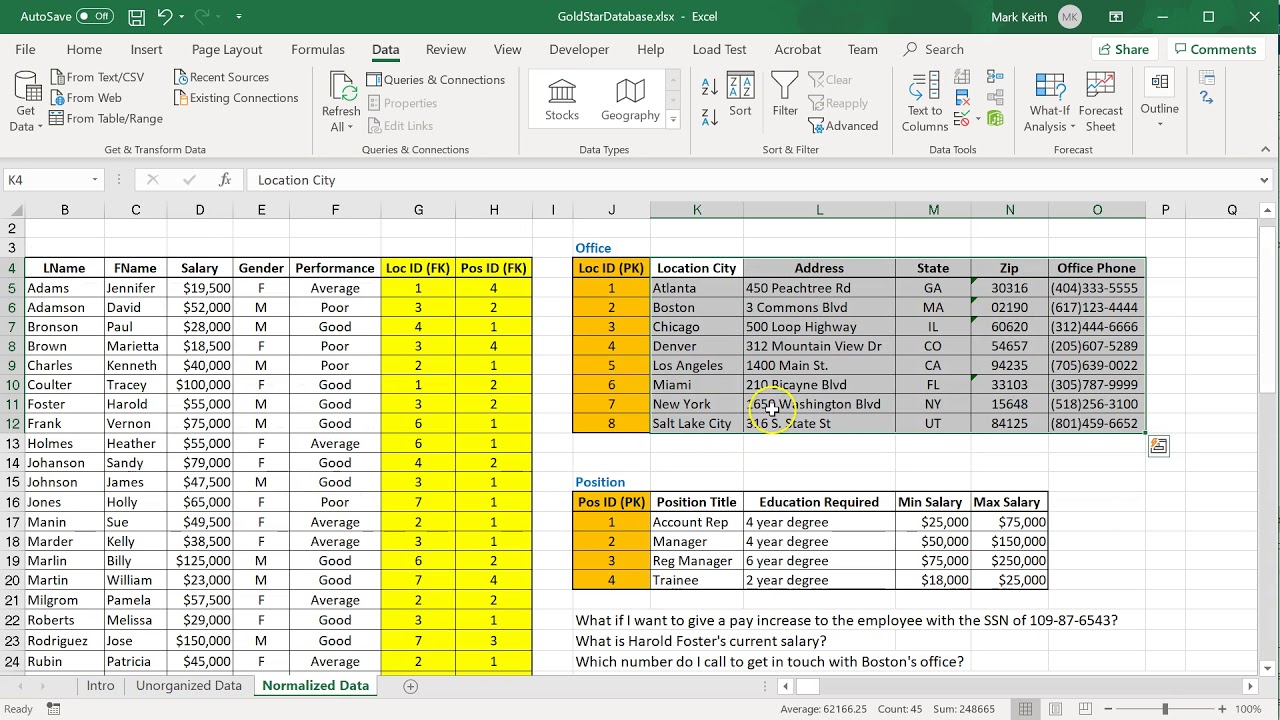
Data normalization in Excel refers to the process of organizing and transforming data to eliminate redundancy and inconsistencies. It involves breaking down complex data into separate tables to efficiently manage and analyze information.
2. Why is data normalization important in Excel?
Data normalization is important in Excel because it improves data integrity and reliability. By organizing data into separate tables and eliminating duplication, it enhances the accuracy and consistency of information. This allows for more efficient data analysis and reduces the risk of errors in calculations and reporting.
3. How do I normalize data in Excel?
To normalize data in Excel, you can follow these steps:
– Identify the data sets and determine the relationships between them.
– Create separate tables for each data set, ensuring that each table has a primary key that uniquely identifies the records.
– Establish relationships between the tables using primary and foreign keys.
– Normalize the data by eliminating redundant information and properly structuring the tables based on the rules of normalization.
4. What are the benefits of normalizing data in Excel?
The benefits of normalizing data in Excel include:
– Improved data integrity: By eliminating redundancy and inconsistencies, normalized data is more accurate and reliable.
– Efficient data management: Normalized data allows for easier data manipulation, analysis, and reporting.
– Reduced data redundancy: Normalization helps to minimize data duplication, resulting in optimized storage and faster query processing.
– Enhanced data scalability: Normalized data structures are more adaptable and scalable, making it easier to accommodate future changes or additions.
5. Are there any limitations to data normalization in Excel?
While data normalization is a valuable technique, it does have some limitations. These include:
– Increased complexity: Normalized data structures can be more complex to understand and manage, especially for users who are not familiar with the concept.
– Performance impact: In some cases, joining multiple normalized tables can impact query performance compared to denormalized data structures.
– Trade-off between normalization and denormalization: Depending on the specific requirements of your data analysis or reporting, there may be instances where denormalization (combining tables for simplicity) is preferable over strict normalization.