Blockchain technology has been making headlines for its ability to facilitate the trading of digital currencies without any risk of fraud or transaction costs associated with traditional methods. It is a decentralized database of transactions, which means it doesn’t rely on a single authority (e.g. the government) to manage information. The control relies on every individual, but every change made is distributed across the network, thus providing more transparency. For this reason, many are now heralding it as the future of everything, from banking and law to voting systems.
Many people want to invest in this new and exciting space but are worried they don’t have enough time to study and stay in tune with all the happenings. For the most part, trading on Blockchain is similar to forex trading, except you’ll be trading non-fiat tokens (NFT) or cryptocurrencies. You will also need a good understanding of the market to be a successful cryptocurrency trader. In this article, we will discuss some of the best MT4 indicators so you know when to trade cryptocurrencies.
Inside This Article
5 Best MT4 Indicators for Cryptocurrency Trading
MetaTrader 4 (MT4) is a popular online trading platform for both forex and cryptocurrency. It provides an array of indicators and charting tools that allow traders to see their real-time forex charts and interpret market action. It will help to have an indicator to help them extract extra value from each trade. Below are some of the MT4 indicators you need to look out for if you are beginning to trade on blockchain.
1. Relative Strength Index (RSI)
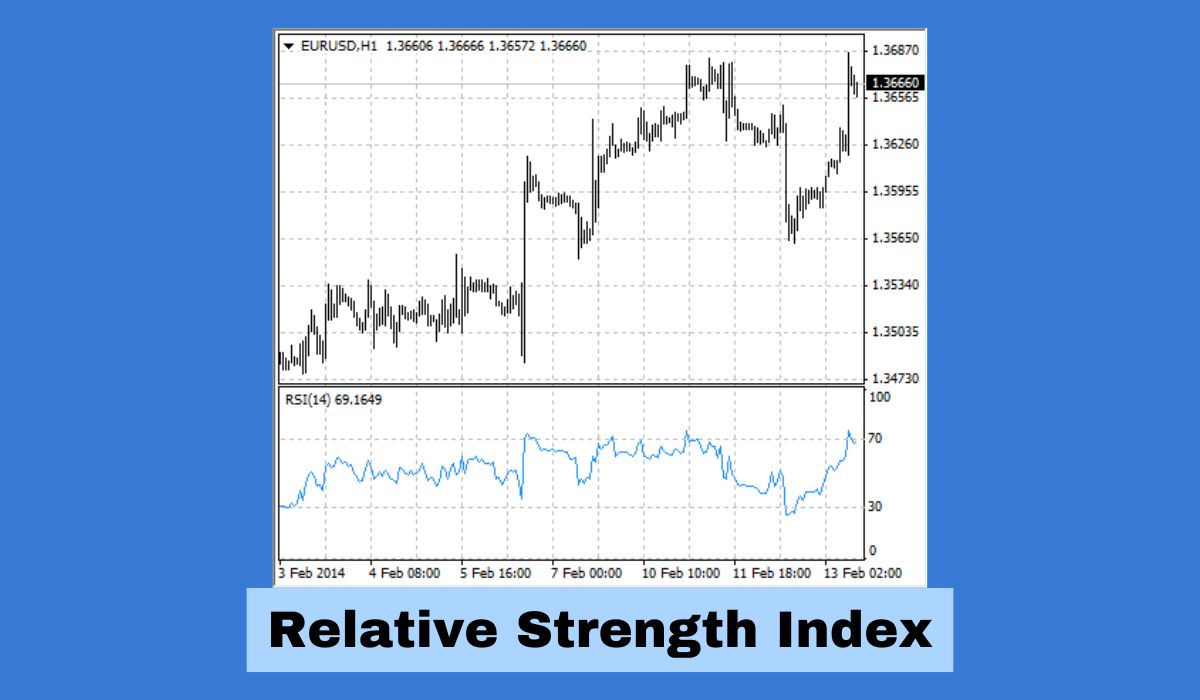
The RSI is a technical indicator that works with trading strategies to assist traders. It can be used to determine momentum in the market and to spot oversold and overbought areas. It also measures relative strengths and potential weaknesses in the trading market. The RSI indicates the difference in price between support levels and resistance levels at which a currency pair begins moving in one direction or another.
By evaluating the oversold and overbought conditions of the RSI, you can determine the momentum in the market and make specific trades. RSI can also predict future price moves by analyzing past patterns. The RSI oscillator works as an indicator of momentum in a given currency pair by measuring a price difference between two specific levels.
2. Moving Average Convergence/Divergence (MACD)
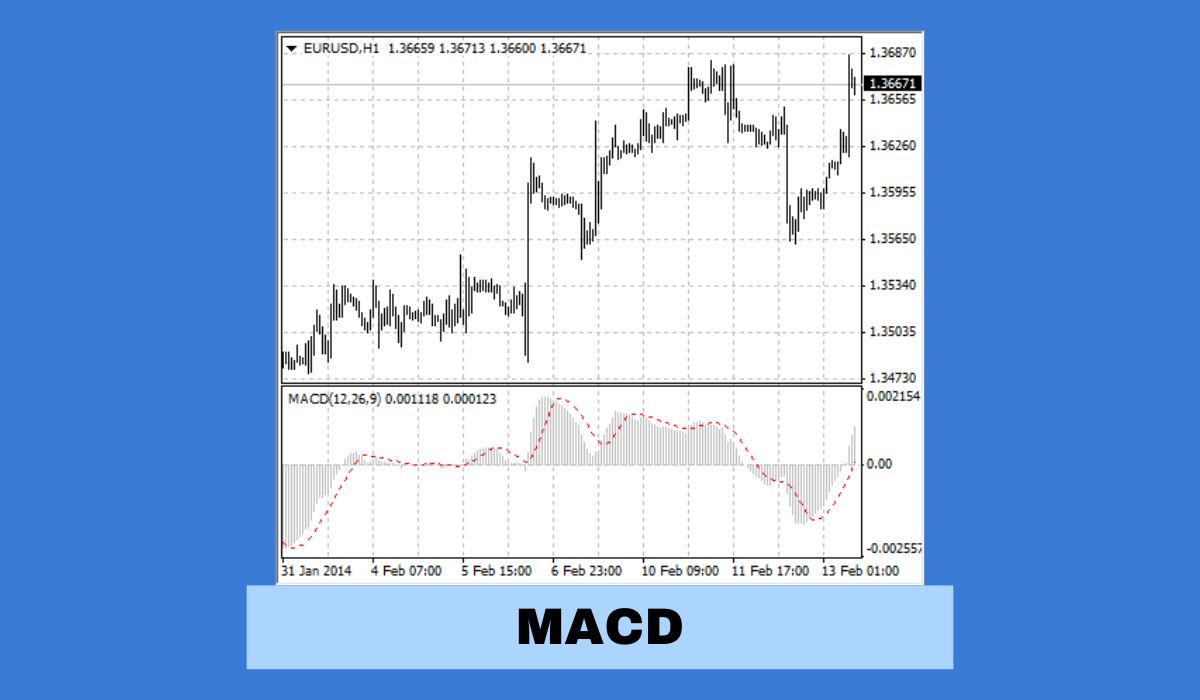
The MACD can identify potential opportunities, including turnaround moments and a currency’s resistance or support levels. The MACD is calculated using two different exponential moving averages of a currency pair. You can use this indicator to determine a particular currency pair’s positive or negative momentum and take appropriate action. The histogram (the horizontal bar chart) shows the trend or momentum in a series of data points. You can use this chart to identify levels of overbought and oversold.
MACD can be used to identify top reversal and bottom reversal points. In a coin pair where the currency is moving in the direction of the stronger currency, the MACD line will move upward, and when it moves downward, the line will move also downward. On such a currency pair opposite is valid for downtrends. The MACD line always moves in a counter direction to the price trend of that currency pair.
3. Stochastic Alert Indicator
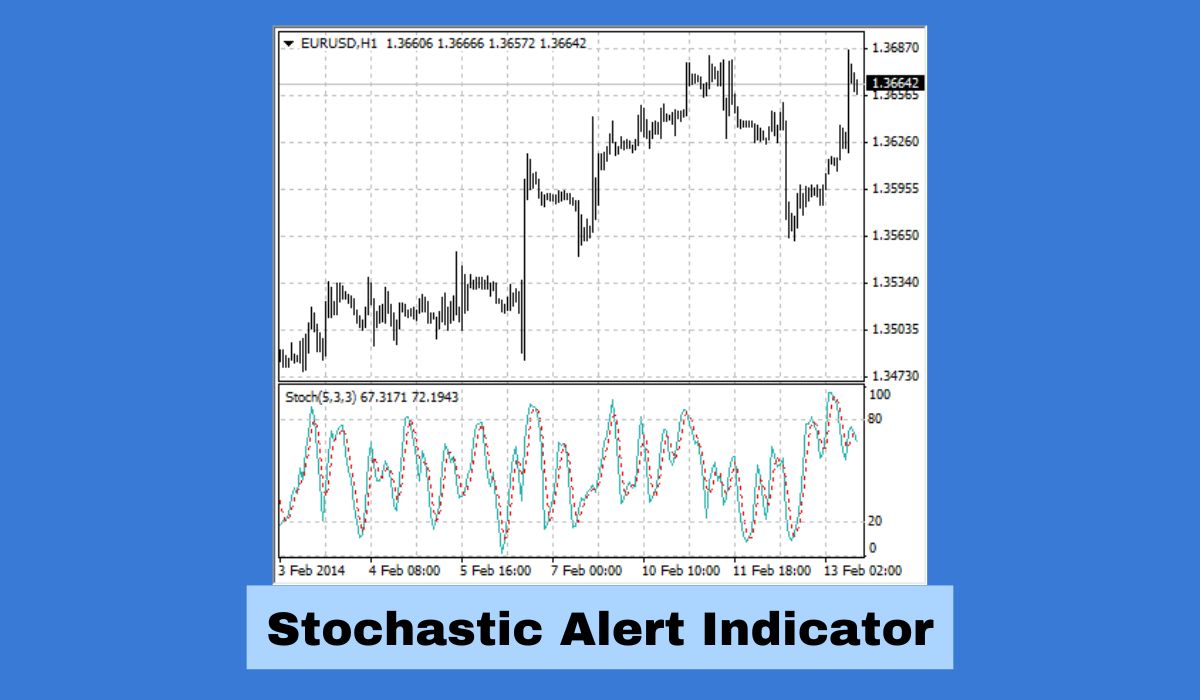
The Stochastic is an oscillator that measures the price movement in a currency pair by measuring the relative values of different price highs and lows. It also determines whether prices are at extreme levels. The oscillator is one of the best MT4 indicators that traders can use to determine price trends and volume. Stochastic is an indicator with two lines (lines O and D) plotted on the same chart. When the price is above both lines, it is a bullish market. When the price is below both lines, it becomes a bearish market.
The oscillator will appear to follow a straight line in a trending market. But if there are no trends in place, these lines can create angles. The dots on the Stochastic lines tell you how a particular currency measures up to the other line and the overall price trend. The red dots represent overbought levels and make up a bullish signal. The blue dots, on the other hand, represent oversold levels that should appear before a market reversal.
4. Vortex Indicator
Vortex is an excellent indicator for pairs that have low liquidity and low volumes. Volume indicates market interest and can indicate price stability in an otherwise turbulent market. This indicator is backed by a large development team that puts a lot of time into research and quality control before releasing updates. Vortex indicators are available to MT4 users in two different varieties, namely Vortex Indicator and Arrow. The arrow variety includes all the indicators but is not as customizable as the standard version.
The vortex indicator is useful for day trading, scalping, swing trading, and position trading in any currency pair. The indicator comes with an easy-to-use interface which is perfect for beginners. It also includes a full suite of charts that shows trend lines, price zones, and the current trend. You can use the indicator to identify price highs and lows, basic levels of support and resistance, or a short-term or long-term trend. Once you download the indicator on your platform, it will become a permanent fixture on your screen. You can access the arrow indicator anytime by clicking on the arrows in your chart.
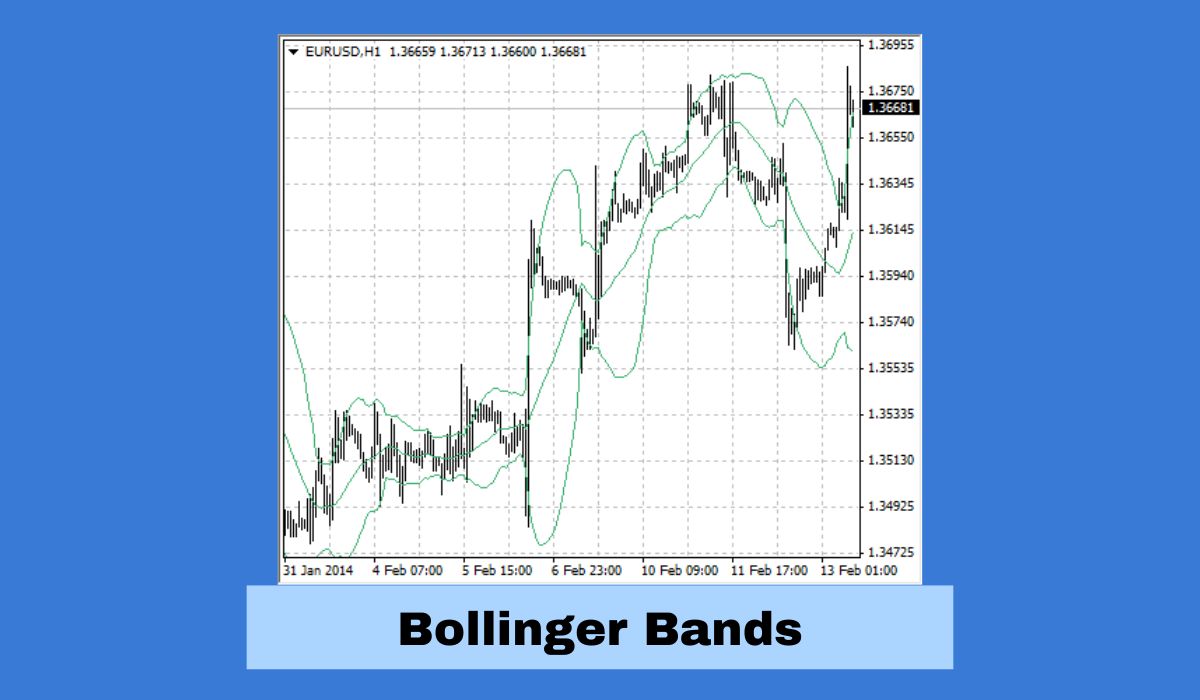
5. Bollinger Bands App
You can use the Bollinger bands to measure the volatility of a certain currency pair. The indicator is virtually applicable to any trading strategy but is particularly useful in binary options and Forex.
John Bollinger, an investing expert, developed the Bollinger Bands indicator. It comes complete with two lines plotted on a chart, indicates volatility, and provides price targets. The indicator helps to create a strategy that targets the high-volatility and low-volatility areas, allowing you to avoid false entries while capturing these key points. Bollinger Bands works on the 1-minute bars, with the upper and lower bands being used only in downtrends. The top band will show a stable level, while the bottom band will show a volatile market ready to explode.
The indicator can supplement existing trading strategies as well as help with the technical analysis of different pairs based on supply/demand-related information. The indicators work with virtually any technical analysis, including support and resistance levels, price action, and volume. The indicator is perfect for forex traders who need a powerful tool to confirm the perceived trends in currency markets.
Conclusion
If you are starting in the exciting world of online trading, avoid falling into the traps and mistakes of impulsive trading. You must have a great understanding of what the MT4 indicators are and how they work. You don’t have to rely on just one indicator to make all your decisions. Use a combination of indicators from different groups based on the situation.
