
Are you tired of dealing with rows of data that should be in a column format? Don’t worry, because in this article, we will walk you through the process of turning a row of data into a column. Whether you’re working with spreadsheets, databases, or any other type of data, this guide will provide you with the step-by-step instructions you need to sort out your information and make it more manageable. With a few simple techniques and a little bit of know-how, you’ll be able to transform your data from a jumbled mess into a neat and organized column, making it easier to analyze, manipulate, and present. So, let’s dive in and discover how to turn a row of data into a column!
Inside This Article
- Overview of the Data Restructuring Process
- Step 1: Transpose the Row Data
- Step 2: Adjust Data Alignment
- Step 3: Clean and Format Transposed Data
- Step 4: Add Labels and Headers
- Step 5: Evaluate and Validate the Column Data
- Step 6: Apply Custom Formatting or Calculations
- Step 7: Save and Share the Transposed Column Data
- Conclusion
- FAQs
Overview of the Data Restructuring Process
Restructuring data from rows to columns is a common task when dealing with large datasets. This process involves transforming a row of data into a column, which can be beneficial for analysis, visualization, or exporting purposes. By converting a row-oriented structure into a column-oriented format, you can easily navigate and manipulate the data to derive meaningful insights.
The data restructuring process typically consists of several steps to ensure data integrity and usability. These steps include transposing the row data, adjusting data alignment, cleaning and formatting the transposed data, adding labels and headers, evaluating and validating the column data, applying custom formatting or calculations, and finally, saving and sharing the transposed column data.
By following these steps, you can efficiently organize and transform your row data into a more manageable and structured format. Whether you are working with financial data, survey results, or any other data-intensive project, understanding how to restructure data from rows to columns is a valuable skill that can enhance your data analysis capabilities.
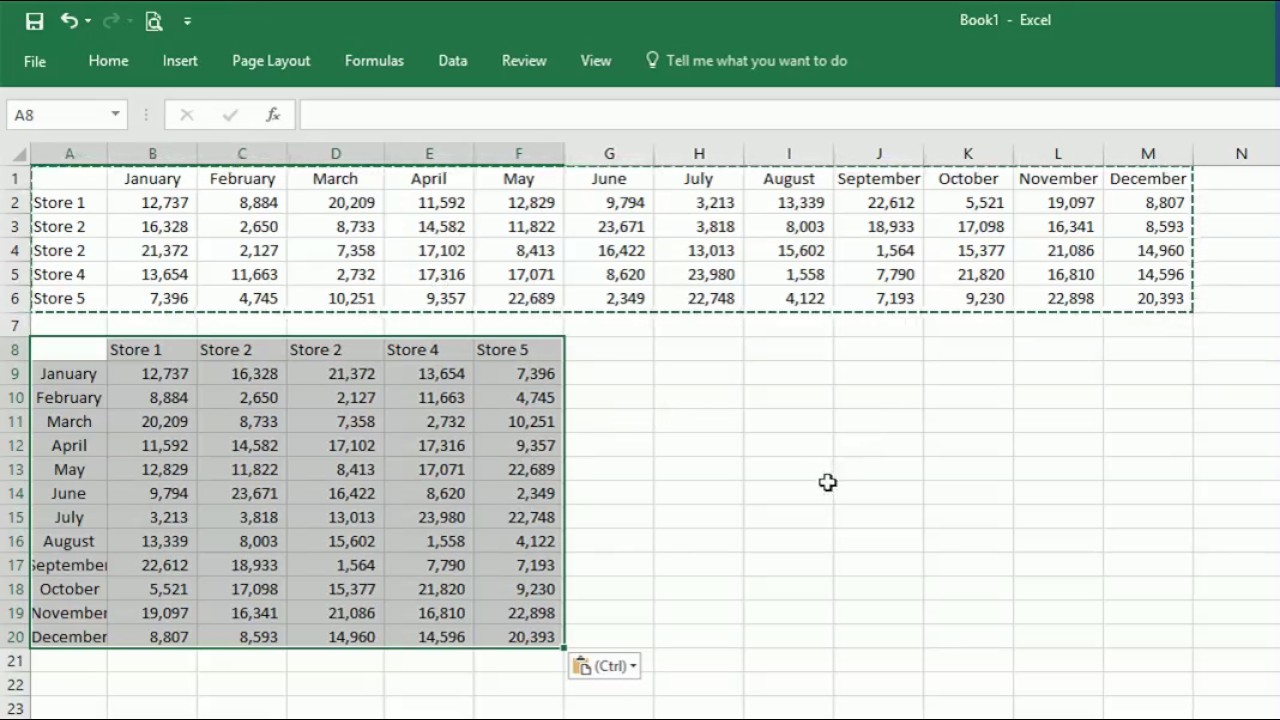
Step 1: Transpose the Row Data
Transposing row data into a column is an essential step in restructuring and organizing your data. This process involves converting data that is arranged in a row-wise format into a column-wise format. By doing so, you can gain better visibility and analysis capabilities of your data.
To transpose the row data, you need to follow these steps:
- Select the entire row of data that you want to transpose.
- Right-click on the selected data and choose the “Copy” option.
- Navigate to the desired location where you want the transposed data to appear.
- Right-click on the cell where you want the transposed data to start and choose the “Paste Special” option.
- In the “Paste Special” dialog box, select the “Transpose” option and click “OK”.
- Voila! Your row data is now transposed into a column.
This process is not limited to a specific software or tool. It can be done in popular spreadsheet programs like Microsoft Excel, Google Sheets, or even in programming languages like Python or R.
Transposing row data into a column format offers several benefits. It makes it easier to analyze and compare data, especially when you have numerous rows and want to focus on specific variables or attributes. Additionally, it can enhance the readability and presentation of your data.
Now that you have successfully transposed your row data into columns, you can move on to the next step in the data restructuring process.
Step 2: Adjust Data Alignment
Once you have successfully transposed the row data into a column format, the next step is to adjust the data alignment. Data alignment refers to the positioning of the data within each cell of the column.
Adjusting the data alignment is crucial to ensure that the column data is visually appealing and easy to read. Proper alignment also helps to maintain consistency and coherence throughout the dataset.
There are three main types of data alignment that you can use:
- Left alignment: This aligns the data to the left-hand side of the cell. It is commonly used for text or numerical data that does not require any specific formatting.
- Right alignment: This aligns the data to the right-hand side of the cell. It is commonly used for numerical data, such as monetary values or percentages.
- Center alignment: This aligns the data to the center of the cell. It is commonly used for headings or data that requires visual emphasis.
To adjust the data alignment, follow these steps:
- Select the range of cells that you want to align.
- Click on the “Align” or “Alignment” option in your spreadsheet software. This can usually be found in the toolbar or in the formatting options.
- Choose the desired alignment option: left, right, or center.
- Apply the alignment to the selected cells.
Once you have adjusted the data alignment, take a moment to review the column and ensure that the alignment looks visually appealing and consistent. This step will help make the column data easier to read and interpret.
Remember, proper data alignment is essential to present your data in a clear and professional manner. It enhances the readability of the column and makes it easier for others to understand the information you are presenting.
Step 3: Clean and Format Transposed Data
Once the data has been transposed and aligned properly, the next step is to clean and format the transposed data. This involves removing any unnecessary characters, correcting formatting inconsistencies, and applying appropriate data types to the column.
Here are some key considerations when cleaning and formatting transposed data:
- Remove unwanted characters: Scan through the column and remove any special characters, symbols, or leading/trailing spaces that are not relevant to the data you are working with.
- Fix formatting issues: Check if the data in the column is formatted consistently. This includes ensuring consistent use of date formats, decimal points, and currency symbols. If you notice any inconsistencies, take the necessary steps to standardize the formatting.
- Apply appropriate data types: Depending on the nature of the data, it is important to assign the correct data types to the column. For example, if dealing with numerical data, ensure it is formatted as numbers, not text. This will allow for accurate calculations and analysis.
- Handle missing or erroneous data: Identify and address any missing or incorrect data in the column. This may involve filling in missing values with appropriate placeholders or correcting any errors. Having clean and accurate data is crucial for reliable analysis and reporting.
- Validate the data: Double-check the transposed column data to ensure its accuracy and integrity. Look out for any outliers, inconsistencies, or unexpected patterns that could impact the analysis or interpretation of the data.
- Apply necessary transformations: As part of the cleaning and formatting process, you may need to apply additional transformations to the data. This could include converting units, categorizing data into groups, or aggregating data based on specific criteria.
By thoroughly cleaning and formatting the transposed data, you can ensure its quality and consistency, making it easier to work with and analyze. This step is essential for accurate insights and decision-making based on the column data.
Step 4: Add Labels and Headers
Once the row of data has been successfully transposed into a column, the next step is to add labels and headers to clearly identify and organize the data.
Labels provide a descriptive name for the column and help users understand the type of data contained within it. Headers, on the other hand, act as a reference point for the column and facilitate easy navigation and sorting.
Here are a few guidelines to follow when adding labels and headers:
- Choose Descriptive Labels: Select labels that accurately represent the data in the column. This helps users quickly understand the content without having to refer to additional documentation.
- Use Clear and Consistent Formatting: Ensure that the labels and headers are visually distinct from the rest of the data. This can be achieved by using bold or larger font sizes, different colors, or formatting options such as underline or italics, depending on your preference.
- Align Labels and Headers: Position the labels and headers at the top of the column. This makes it easier for users to identify and locate specific information.
- Consider Including Units or Symbols: If the data in the column represents a specific measurement or includes a currency symbol, consider including this information in the label or header. This provides additional context and avoids any confusion.
By adding labels and headers, you not only make the column more visually appealing but also improve its usability. Users can quickly scan the data, understand its meaning, and navigate through the column with ease.
Remember, the goal is to make the data easily comprehensible, especially when working with large datasets or sharing the column with others. Clear labeling and headers go a long way in achieving this objective.
Step 5: Evaluate and Validate the Column Data
Once you have successfully transposed the row data into a column, the next step is to evaluate and validate the column data. This is an important step to ensure the accuracy and integrity of your data before further analysis or reporting.
Here are some key points to consider when evaluating and validating the column data:
- Check for inconsistencies: Examine the data for any inconsistencies or discrepancies. Look for misspellings, different variations of the same value, or any other anomalies that may impact the quality of your data.
- Identify outliers: Scan the column for any outliers or values that deviate significantly from the rest. Outliers can distort statistical analysis and may need to be investigated further to determine their validity.
- Validate data against known values: If you have a set of known values or reference data, compare the column data against these values. This can help identify any data entry errors or missing values that need to be addressed.
- Perform data cleaning: Remove any unnecessary characters, symbols, or formatting issues from the column data. This can include removing leading or trailing spaces, converting text to proper case, or ensuring consistent date or number formats.
- Handle missing values: Check for any missing values in the column data. Decide on the appropriate approach to handle missing data, whether it’s imputing values, excluding them from analysis, or seeking additional information to fill in the gaps.
- Consider data constraints: Validate the column data against any constraints or business rules that may apply. For example, if the column represents a numeric field, ensure that the values fall within a specific range or adhere to specific formatting requirements.
- Ensure data integrity: Verify the overall integrity of the column data by cross-referencing it with other related data or performing calculations to confirm its accuracy. This step is crucial in ensuring that your analysis or reports are based on reliable and trustworthy data.
By thoroughly evaluating and validating the column data, you can address any issues or discrepancies early on, leading to more accurate analysis and decision-making. Remember, the quality of your data directly impacts the insights you can derive from it, so invest time and effort in this crucial step of the data restructuring process.
Step 6: Apply Custom Formatting or Calculations
Once you have transposed your row data into a column and adjusted the alignment, it’s time to apply custom formatting or calculations to the data. This step allows you to tailor the appearance and functionality of your column to meet your specific needs.
Custom formatting can be applied to change the appearance of the data, such as the font style, size, color, or adding conditional formatting based on certain criteria. This can make your data more visually appealing and easier to interpret.
Calculations, on the other hand, allow you to perform mathematical operations on the column data. For example, you can calculate the sum, average, maximum, or minimum value of the data using formulas or functions. This can provide valuable insights and help you make data-driven decisions.
To apply custom formatting or calculations, you can use different tools and software depending on your preferences and the complexity of your requirements. Spreadsheets like Microsoft Excel or Google Sheets offer a wide range of formatting options and built-in functions that can be used to customize and calculate your column data.
If you are working with programming languages like Python or R, you can leverage libraries and functions specific to data manipulation and analysis. These languages provide powerful tools for custom formatting and advanced calculations, giving you more flexibility and control over your column data.
Remember to consider the purpose of your column and the intended audience when applying custom formatting or calculations. Keep it clear, concise, and relevant, ensuring that the formatting and calculations add value to the data without overwhelming or confusing the readers.
Step 7: Save and Share the Transposed Column Data
Once you have successfully transposed the row data into a column and made all the necessary adjustments, it’s time to save and share the transformed data. Saving the transposed column data ensures that you can easily access and use it for future analysis or reporting purposes.
To save the transposed column data, you have a few options depending on the software or tool you are using. If you are working in a spreadsheet program like Microsoft Excel or Google Sheets, you can simply click on the “Save” button or use the keyboard shortcut for saving. This will preserve the transposed column data in the current file.
Alternatively, you can also choose to save the transposed column data as a separate file. This can be useful if you want to keep the original row data intact or share the transposed column data with others who may not have access to the original file. To do this, you can go to the “File” menu, select the “Save As” option, and choose a different file format such as CSV, Excel, or PDF.
After saving the transposed column data, it’s important to properly name the file so that you can easily recognize its content. You can use a descriptive name that reflects the data or analysis you have performed. For example, if you transposed a column of sales data by month, you can name the file “Sales_Data_By_Month.xlsx”.
Once you have saved the transposed column data, you can now share it with others. This can be done through various methods depending on your needs and preferences. If you are working within a collaborative environment, you can share the file directly with your colleagues or team members by using the sharing options provided by the software or cloud storage platform you are using.
If you want to share the transposed column data with someone who doesn’t have access to the original file or software, you can convert the file into a more universal format like PDF. This ensures that the recipient will be able to open and view the transposed column data without the need for specific software or tools.
Additionally, you can also consider copy-pasting the transposed column data into a separate document or email if you only want to share a specific portion or summary of the data. This method allows for flexibility and easy integration with other files or documents.
Remember, when sharing the transposed column data, it’s important to consider any privacy or confidentiality concerns. Make sure to remove or anonymize any sensitive or personally identifiable information before sharing the data.
By following these steps, you can successfully save and share the transposed column data, ensuring its accessibility and usefulness for further analysis, reporting, or collaboration.
Conclusion
Converting a row of data into a column can be a valuable skill to have when working with spreadsheets or databases. Whether you’re organizing information, analyzing trends, or performing calculations, being able to rearrange data into a column format can greatly enhance your workflow and efficiency.
In this article, we’ve explored several methods for transforming a row of data into a column, such as using the TRANSPOSE function in Excel or Google Sheets, utilizing the UNPIVOT operator in SQL, or employing scripting languages like Python or R. Each method has its own strengths and applications, so it’s important to choose the approach that best suits your specific needs.
Remember to consider the size and complexity of your dataset, as well as the tools and software available to you, when deciding on the most appropriate method for converting a row of data into a column. With practice and experimentation, you’ll become proficient in this data manipulation technique, helping you to unlock valuable insights and streamline your data analysis processes.
FAQs
1. What is a row of data and how is it different from a column?
A row of data is a representation of information arranged horizontally in a dataset. Each row typically contains different attributes or variables related to a specific entity or observation. On the other hand, a column represents a vertical arrangement of data, often containing values for a specific attribute or variable across multiple entities or observations. In summary, a row contains data for a single entity, while a column contains data for a specific attribute or variable across multiple entities.
2. Why would I want to turn a row of data into a column?
There can be various reasons to convert a row of data into a column. One common scenario is when you have a dataset where the attributes or variables are represented as rows, but you need them to be arranged as columns for easier analysis or visualization. By transforming a row of data into a column, you can easily compare and analyze the values for a specific attribute across different entities or observations.
3. How can I turn a row of data into a column in Excel?
In Excel, you can use the TRANSPOSE function to convert a row of data into a column. Here’s how you can do it:
- Select and copy the row of data you want to transpose.
- Select a new location where you want the transposed data to appear.
- Right-click on the new location and choose the Paste Special option.
- In the Paste Special dialog box, check the Transpose option.
- Click OK, and Excel will transpose the row of data into a column.
4. Is it possible to turn a row of data into a column in SQL?
Yes, you can convert a row of data into a column in SQL using the PIVOT or UNPIVOT operators, depending on your specific requirements. PIVOT allows you to rotate rows into columns, aggregating data based on a specific column or columns, while UNPIVOT performs the opposite operation by converting columns into rows. These operators can be useful when you need to transform your data for reporting or analysis purposes.
5. Are there any tools or software that can help me turn a row of data into a column?
Yes, there are several tools and software available that can assist you in converting a row of data into a column. Some popular options include Microsoft Excel, which we mentioned earlier, as well as data manipulation tools like Python pandas, R tidyr, and SQL’s PIVOT and UNPIVOT operators. These tools provide flexible methods for transforming your data, allowing you to easily restructure rows into columns or vice versa.