
Are you struggling to change axis data in Excel? Adjusting the axis data in Excel is a crucial skill for anyone working with data visualization or creating charts and graphs. Whether you’re looking to modify the labels, format the axis values, or customize the scale, knowing how to change axis data in Excel can significantly improve the clarity and effectiveness of your visual representation.
In this article, we’ll explore various techniques and methods to change axis data in Excel, along with step-by-step instructions to ensure you can easily manipulate the axis information to suit your specific needs. So, whether you’re a data analyst, a student, or a business professional, understanding how to change axis data in Excel will empower you to create more visually appealing and informative charts and graphs.
Inside This Article
- Overview
- Method 1: Changing Axis Data using Data Source
- Method 2: Adjusting Axis Data using Chart Tools
- Method 3: Modifying Axis Data through the Select Data Source
- Method 4: Updating Axis Data using Formulas
- Conclusion
- FAQs
Overview
When working with Excel, it’s common to create charts and graphs to visualize data. These visual representations can make it easier to understand and interpret complex data sets. One important aspect of creating charts is managing the axis data. The axis data refers to the values displayed along the X and Y axes of the chart.
Changing the axis data in Excel allows you to customize the information displayed on the chart. You can modify the axis labels to represent different categories, change the range of values displayed, or even use formulas to dynamically update the axis data based on other cells in your spreadsheet.
In this article, we will explore different methods to change the axis data in Excel. Whether you want to update the axis labels, adjust the data range, or use formulas to automatically populate the axis data, we’ve got you covered.
Let’s dive into the various methods available to change axis data in Excel.
Method 1: Changing Axis Data using Data Source
One of the ways to change the axis data in Excel is by using the data source. This method allows you to directly modify the data that is being displayed on the axis of your chart.
To change the axis data using the data source, follow these steps:
- Select the chart in which you want to change the axis data.
- Click on the “Design” tab in the Excel ribbon.
- Locate the “Chart Data” group and click on the “Select Data” button.
- The “Select Data Source” dialog box will appear.
- In the “Legend Entries (Series)” section, select the series for which you want to change the axis data.
- Click on the “Edit” button.
- The “Edit Series” dialog box will appear.
- In the “Series values” box, you can modify the range of data that is being used for the axis.
- Click on the “OK” button to apply the changes.
- Repeat steps 5-9 for any other series that you want to change the axis data for.
- Click on the “OK” button in the “Select Data Source” dialog box to close it.
By using the data source method, you have the ability to control the exact data that is being displayed on the axis of your chart. This allows you to customize and fine-tune your chart to accurately represent your data.
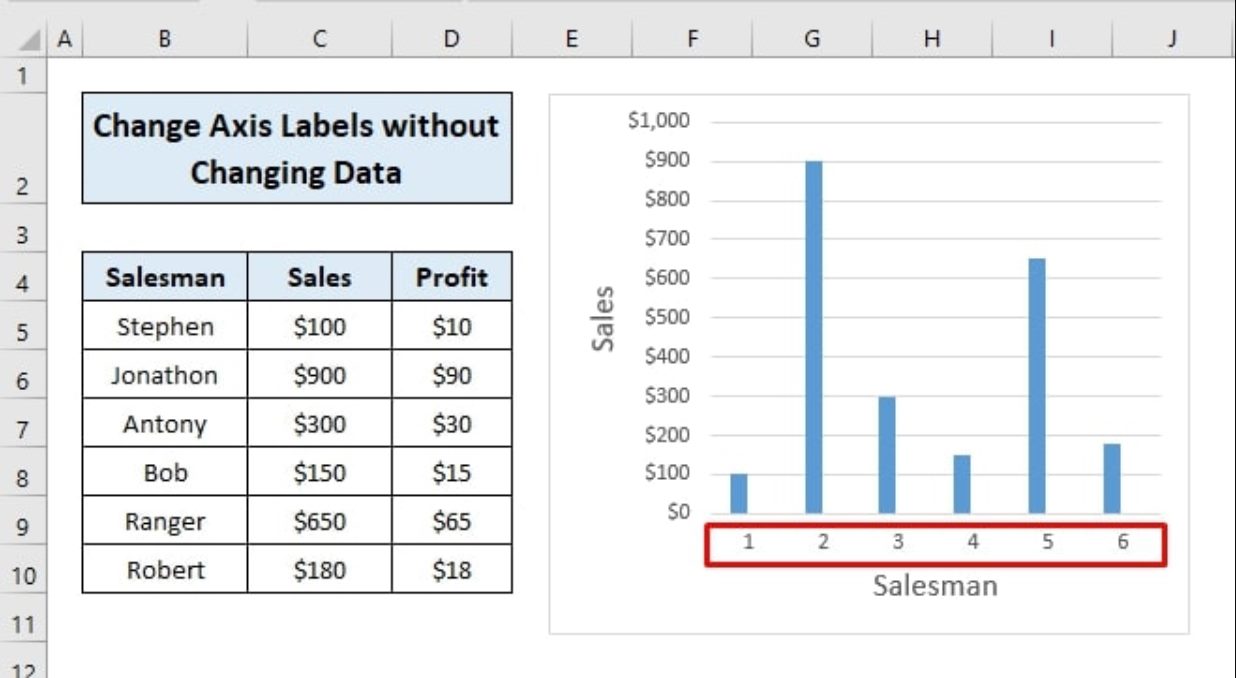
Method 2: Adjusting Axis Data using Chart Tools
Another way to change axis data in Excel is by utilizing the Chart Tools. This method allows you to make adjustments directly on the chart itself, providing a more visual and intuitive experience.
To adjust the axis data using Chart Tools, follow these steps:
- Select the chart in which you want to modify the axis data.
- Click on the “Chart Tools” tab that appears on the Excel ribbon.
- Under the “Design” tab, click on the “Select Data” option.
- A “Select Data Source” window will pop up, displaying the existing axis data.
- To change the axis data, click on the “Edit” button next to the “Horizontal (Category) Axis Labels” or “Vertical (Value) Axis Labels” section.
- In the “Axis Labels” window, you can either type the new range for the axis labels or select the desired range by clicking and dragging your cursor across the cells in your worksheet.
- Click “OK” to apply the changes and close the window.
- Click “OK” again on the “Select Data Source” window to update the chart with the modified axis data.
By using Chart Tools, you have the flexibility to adjust the axis data directly on the chart itself, making it easier to visualize the changes and ensure the accuracy of your data representation. This method can be particularly useful when you want to make quick modifications to the axis data without having to navigate through different menus and dialog boxes.
Method 3: Modifying Axis Data through the Select Data Source
Modifying axis data in Excel charts is a crucial step to accurately represent your data and convey meaningful insights. In this method, we will explore how you can modify axis data by using the “Select Data” option in Excel. Follow the steps below to get started:
1. Select your chart: Click on the chart where you want to modify the axis data. This will activate the Chart Tools menu.
2. Navigate to the “Design” tab: In the Chart Tools menu, click on the “Design” tab located at the top of the Excel window.
3. Click on “Select Data”: Within the “Data” group in the “Design” tab, click on the “Select Data” option. This will open the “Select Data Source” dialog box.
4. Edit the axis labels: In the “Select Data Source” dialog box, you will see the “Horizontal (Category) Axis Labels” and “Vertical (Value) Axis Labels” sections. Click on the “Edit” button for the axis you want to modify.
5. Modify the axis data range: In the “Axis Labels” dialog box, you can update the data range for the axis labels. You can either manually type in the range or use the range selection tool to select the desired range on your worksheet.
6. Apply the changes: Once you have entered or selected the new data range, click on the “OK” button in the “Axis Labels” dialog box.
7. Confirm the changes: Back in the “Select Data Source” dialog box, you will see the updated data range under the respective axis section. Review the changes and click on the “OK” button to confirm.
8. View the updated chart: The chart will now display the modified axis data based on the changes you made. Check whether the axis labels accurately represent your data.
By following the steps outlined in this method, you can easily modify axis data in Excel using the “Select Data” option. This allows you to customize your charts and better showcase your data in a visually appealing manner.
Method 4: Updating Axis Data using Formulas
One of the most powerful and flexible ways to update axis data in Excel is through the use of formulas. By leveraging the computational power of Excel’s formula functions, you can dynamically update the data on your chart’s axis based on changing values in your worksheet. This method allows for real-time updates and automatic adjustments to your axis data.
To update the axis data using formulas, follow these steps:
- Identify the range of cells in your worksheet that contains the data you want to use for the axis labels. This can be a column of values or a row of labels.
- Write a formula that represents the desired data for your chart’s axis. You can use various Excel functions, such as CONCATENATE, IF, VLOOKUP, or INDEX, to manipulate and combine values based on your specific requirements.
- Select the axis whose data you want to update. You can do this by clicking on the chart and navigating to the Chart Tools tab, where you’ll find the Format Axis options.
- In the Format Axis pane, go to the Axis Options section and find the Axis Labels or Category Axis Labels settings. Here, you’ll be able to specify the data range for your axis labels.
- Enter the formula you created in step 2 into the Axis Labels Range input box. Make sure to include the equal sign “=” at the beginning of the formula.
- Press Enter or click outside the input box to apply the formula. Excel will automatically update the axis labels based on the formula you provided.
Updating axis data using formulas allows you to have ultimate control and flexibility over the data displayed on your chart. You can easily change the underlying data in your worksheet, and the axis labels will be automatically adjusted based on the updated values. This method is particularly useful when dealing with dynamic data sets or when you want to create charts that update in real-time.
Remember to keep your formulas error-free and to double-check for any circular references that might occur when your axis data formula refers to the chart itself. Additionally, consider using named ranges to make your formulas cleaner and easier to manage.
With the power of formulas, you can take your Excel charts to the next level by updating axis data dynamically. Whether you need to track changing trends, analyze data patterns, or showcase real-time information, using formulas to update axis data will enable you to create impactful visualizations that accurately reflect your data.
Conclusion
Changing axis data in Excel is a powerful feature that allows users to customize their charts and graphs based on specific requirements. By adjusting the axis data, users can effectively control the range, scale, and appearance of their visual representations. Whether you need to modify the labels, adjust the intervals, or switch the axis orientation, Excel provides a range of options to suit your needs.
By following the simple steps outlined in this guide, you can confidently manipulate axis data in Excel and create visually appealing and informative charts. Remember to consider the purpose of your chart or graph and make adjustments accordingly to effectively convey your data. Experiment with different settings and formats to find the combination that best suits your needs and enhances the overall impact of your data visualization.
With a bit of practice and exploration, you can harness the full potential of Excel’s axis data editing capabilities to bring your data to life and make it more understandable for your audience.
FAQs
1. How do I change axis data in Excel?
To change axis data in Excel, follow these steps:
1. Select the chart you want to modify.
2. Click on the Chart Elements button that appears when you hover over the chart.
3. Check the box next to “Axis Titles” to display the axis labels.
4. Click on the axis label you want to change and type in the new label.
5. Press Enter to save the changes.
By following these steps, you can easily change the axis data in Excel charts.
2. Can I change the axis format in Excel?
Yes, you can change the axis format in Excel. To do this, follow these steps:
1. Select the chart you want to modify.
2. Click on the Format tab which appears when you select the chart.
3. In the Format Axis pane, you can make changes to the axis format such as font style, color, size, and axis labels.
4. Customize the desired format and click Apply to see the changes.
By following these steps, you can easily customize the axis format in Excel charts.
3. How do I switch the x and y axis in Excel?
To switch the x and y axis in Excel, follow these steps:
1. Select the chart you want to modify.
2. Click on the Format tab which appears when you select the chart.
3. In the Format Axis pane, click on the “Switch Row/Column” option.
4. The x and y axis will be switched in the chart view.
By following these steps, you can quickly switch the x and y axis in Excel charts.
4. Can I change the interval of the axis in Excel?
Yes, you can change the interval of the axis in Excel. To do this, follow these steps:
1. Select the chart you want to modify.
2. Click on the Format tab which appears when you select the chart.
3. In the Format Axis pane, click on the axis options.
4. Customize the interval by selecting the appropriate options, such as “Fixed” or “Automatic”.
5. Adjust the interval values as per your requirement.
By following these steps, you can easily change the interval of the axis in Excel charts.
5. How do I change the axis range in Excel?
To change the axis range in Excel, follow these steps:
1. Select the chart you want to modify.
2. Click on the Format tab which appears when you select the chart.
3. In the Format Axis pane, click on the axis options.
4. Customize the axis range by selecting the appropriate options, such as “Fixed” or “Automatic”.
5. Adjust the minimum and maximum values as per your requirement.
By following these steps, you can easily change the axis range in Excel charts.