
If you’re a website owner or digital marketer, you know how essential it is to track and analyze your website’s performance. One of the most popular and powerful tools for this purpose is Google Analytics. Google Analytics provides a wealth of data and insights that can help you make informed decisions and improve your website’s performance.
However, at times you may find yourself needing to export the data from Google Analytics for further analysis or reporting. Whether you want to conduct deep-dive analysis, create custom reports, or share data with clients or team members, exporting data from Google Analytics can be a valuable task to master.
In this article, we will guide you through the process of exporting data from Google Analytics. We will cover various methods and explain step-by-step how you can retrieve the data you need. So, if you’re ready to unlock the full potential of your Google Analytics data, let’s get started!
Inside This Article
- Overview
- Step 1: Accessing Google Analytics
- Step 2: Selecting the Data Range
- Step 3: Choosing the Data to Export
- Step 4: Exporting Data as CSV
- Step 5: Saving and Accessing Exported Data
- Conclusion
- FAQs
Overview
Google Analytics is a powerful tool that helps website owners and marketers gain valuable insights into their website’s performance. One of its key features is the ability to export data, allowing users to analyze and manipulate the data outside of the Google Analytics interface. This article will guide you through the process of exporting data from Google Analytics, helping you harness the power of your website’s analytics for more in-depth analysis.
Exporting data from Google Analytics enables you to extract specific information such as website traffic, user behavior, conversion rates, and more. Whether you need to analyze data in a different format, create custom reports, or integrate it with other tools, exporting the data gives you the flexibility to work with the information in a way that meets your specific needs.
By following the step-by-step process outlined in this article, you will be able to navigate Google Analytics’ interface and easily export the desired data. From accessing Google Analytics to saving and accessing the exported data, we will provide you with all the information you need to successfully export data from Google Analytics.
So, if you’re ready to take your website analytics to the next level and gain deeper insights into your website’s performance, let’s dive into the process of exporting data from Google Analytics.
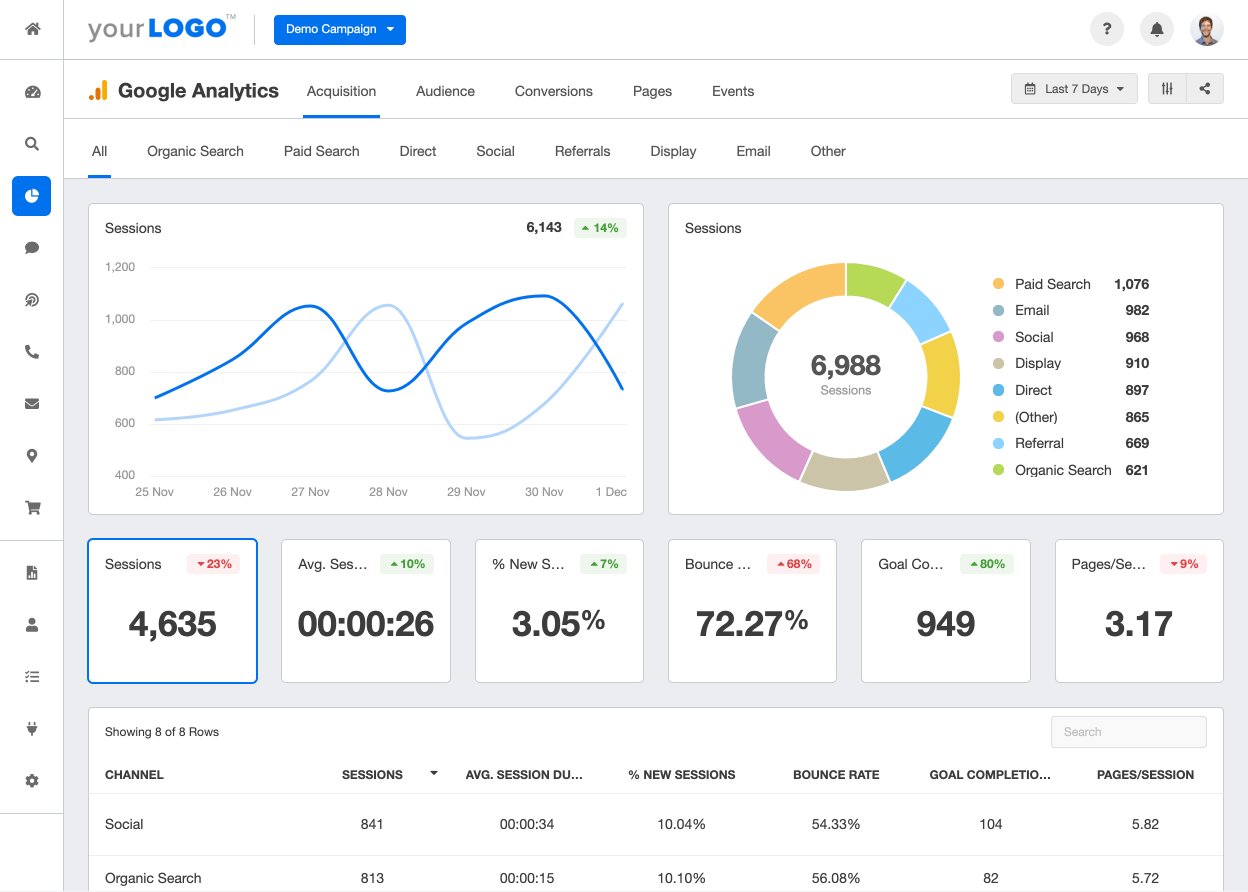
Step 1: Accessing Google Analytics
Google Analytics is a powerful tool that allows you to track and analyze website traffic and user behavior. To begin exporting data from Google Analytics, the first step is accessing your account. Here’s how:
1. Open a web browser and navigate to analytics.google.com.
2. If you already have a Google account, click on the “Sign in” button in the top-right corner of the page. Enter your email address and password to log in.
3. If you don’t have a Google account, click on the “Create account” link and follow the instructions to create a new account.
4. Once you’re signed in, you’ll be directed to the Google Analytics homepage. Here, you can view an overview of your website’s performance, access various reports, and configure settings.
5. To navigate to the reporting section where you can export data, click on the “Reporting” tab located in the left-hand menu.
By following these steps, you’ll be able to access Google Analytics and proceed to export the data you need for analysis and reporting.
Step 2: Selecting the Data Range
Once you have accessed Google Analytics and logged into your account, the next step is to select the data range you want to export. This step is crucial as it determines the timeframe of the data you will retrieve. Google Analytics provides various options to choose from, allowing you to have control over the data you export.
To select the data range, locate the date range picker at the top right of your Google Analytics dashboard. By default, it is set to the last 7 days. Click on the date range to open the calendar view and choose a specific range or select one of the predefined intervals such as Today, Yesterday, Last 7 Days, Last 30 Days, or Custom.
If you choose the Custom option, you will be able to manually specify the start and end dates of the data range. This is particularly useful if you want to analyze data for a specific campaign, event, or time period. Simply click on the start and end dates on the calendar to set them accordingly.
Additionally, Google Analytics allows you to compare two date ranges, providing deeper insights into your website’s performance. This feature can be accessed by clicking on the “Compare to” checkbox below the date range picker. You can choose to compare the selected range to the previous period, previous year, or a custom range.
By selecting the appropriate data range, you ensure that the exported data is relevant to your analysis and reporting needs. It allows you to focus on specific timeframes and track the progress of your website over different periods. Take the time to choose the data range that will provide the most valuable insights for your business goals.
Step 3: Choosing the Data to Export
Once you have accessed your Google Analytics account and selected the desired data range, the next step is to choose the specific data you want to export. Google Analytics offers a wide range of metrics and dimensions to choose from, allowing you to tailor your data export according to your specific needs and requirements.
Here are a few key considerations to keep in mind when choosing the data to export:
- Metrics: Metrics are the quantitative measurements that provide insights into different aspects of your website’s performance. Examples of metrics include sessions, pageviews, bounce rate, conversion rate, and average session duration. Consider the objectives of your analysis and select the metrics that align with your goals.
- Dimensions: Dimensions provide additional context to your metrics by categorizing or segmenting the data. They include parameters such as traffic source, device category, location, and landing page. Choosing the right dimensions will help you gain deeper insights into your audience and their behavior.
- Filters: If you want to narrow down your data even further, you can apply filters to exclude or include specific subsets of your data. For example, you can filter out internal traffic or focus only on a particular geographical region. Filters can be a powerful tool in refining your data export.
- Segments: Segments allow you to isolate specific subsets of your audience based on certain criteria. For instance, you can create a segment for new users or returning visitors. By applying segments, you can analyze the behavior and performance of different user segments separately, providing valuable insights.
- Customization: Google Analytics offers customization options that allow you to create custom metrics, dimensions, and reports. This can be useful if you have specific requirements or want to track unique data points that are not available by default. Take advantage of these customization features to tailor your data export to your specific needs.
By carefully selecting the data points that are most relevant to your analysis, you can ensure that you obtain meaningful and actionable insights from your Google Analytics data export.
Step 4: Exporting Data as CSV
Once you have selected the desired data range and chosen the specific data you want to export from Google Analytics, it’s time to export the data as a CSV file. CSV stands for Comma-Separated Values, which is a widely used file format for storing tabular data.
To export the data as a CSV file, follow these simple steps:
- After you have made your data selections, click on the “Export” button located on the top right corner of the page.
- A drop-down menu will appear with various export options. Select the “CSV” option from the list.
- Google Analytics will then generate the CSV file containing your selected data.
- Once the CSV file is ready, you will be prompted to download it. Click on the “Download” button to save the file to your computer.
- Choose a location on your computer where you want to save the CSV file and click “Save”.
That’s it! You have successfully exported your data from Google Analytics as a CSV file. Now, you can use this file for further analysis, reporting, or any other purposes that require the data in a tabular format.
It’s important to note that the CSV file may not contain all the available data in Google Analytics. Depending on your data selections and account settings, certain data points or metrics may be excluded from the exported file.
It’s always a good practice to double-check the exported CSV file to ensure that it contains the desired data and meets your requirements.
Step 5: Saving and Accessing Exported Data
After successfully exporting your data from Google Analytics, the next step is to save and access the exported data. Here’s how you can do it:
1. Choose a suitable destination: Select a location on your computer where you want to save the exported data. It could be a specific folder or directory that you can easily locate later.
2. Name the file: Give the exported file a descriptive and recognizable name. This will make it easier to identify and organize your data in the future. It’s a good practice to include relevant details such as the date, time range, and specific metrics in the file name.
3. File format: Decide on the file format in which you want to save the exported data. Google Analytics offers various file formats such as CSV (Comma Separated Values), TSV (Tab Separated Values), and XLSX (Microsoft Excel). Choose the format that best suits your needs and preferences.
4. Save the file: Once you have chosen the destination, named the file, and selected the desired file format, click on the “Save” button to save the exported data. The file will be saved to the specified location on your computer.
5. Accessing the exported data: Once the file is saved, you can easily access it by navigating to the location where you saved it. You can open the file using a spreadsheet software such as Microsoft Excel or Google Sheets, depending on the chosen file format.
6. Analyzing the data: With the exported data accessible, you can now start analyzing and interpreting the metrics and insights. Use the tools and functionalities provided by the spreadsheet software to perform calculations, create charts, and extract valuable information from the data.
7. Backing up the data: To ensure the safety and longevity of your data, it’s recommended to create backups. Consider storing copies of the exported data in secure cloud storage or external hard drives. Regularly backing up your data will prevent any accidental loss or corruption.
By following these steps, you can save and easily access your exported data from Google Analytics whenever you need to analyze or refer to it in the future.
Conclusion
In conclusion, exporting data from Google Analytics is a valuable skill for anyone looking to gain insights into their website’s performance and make data-driven decisions. By following the steps outlined in this article, you can effectively export and analyze data to extract meaningful information and uncover trends.
Remember, data is power, and Google Analytics provides a wealth of information that can help you optimize your online presence. Whether you are a small business owner, a marketer, or a website administrator, mastering the art of exporting data from Google Analytics will give you a competitive edge in today’s digital landscape.
So, take the time to familiarize yourself with the reporting features in Google Analytics and start harnessing the power of data to drive success. Export, analyze, and make informed decisions to boost your website’s performance and achieve your online goals.
FAQs
1. Why is it important to export data from Google Analytics?
Exporting data from Google Analytics can provide valuable insights into your website’s performance. It allows you to analyze key metrics, track trends, and make data-driven decisions to optimize your website and improve its user experience.
2. How can I export data from Google Analytics?
To export data from Google Analytics, follow these steps:
a. Login to your Google Analytics account.
b. Navigate to the desired view or reporting section.
c. Apply any necessary filters or date ranges.
d. Click on the “Export” button at the top of the page.
e. Select the desired export format (e.g., CSV, Excel, PDF).
f. Choose the data range and the specific data you want to export.
g. Click the “Export” button to initiate the download.
3. What export formats are available in Google Analytics?
Google Analytics offers several export formats, including:
– CSV (Comma Separated Values): Suitable for importing data into spreadsheets or performing advanced data analysis.
– Excel (XLSX): Allows you to manipulate data using Excel’s powerful features.
– PDF (Portable Document Format): Provides a visually appealing snapshot of your data that can be shared or printed.
4. Can I schedule automatic data exports in Google Analytics?
Yes, Google Analytics allows you to schedule automatic data exports through the Google Analytics API or using third-party tools. This feature is particularly useful for regular reporting or data sharing within your organization.
5. What data can I export from Google Analytics?
With Google Analytics, you can export a wide range of data, including:
– Audience data: Demographics, user behavior, and device information.
– Acquisition data: Traffic sources, campaign performance, and referral data.
– Behavior data: Website content performance, conversion rates, and user engagement.
– Ecommerce data: Sales performance, product revenue, and transaction details.
– Custom reports: Data specific to your business goals, such as event tracking or custom dimensions.