
Are you looking for a convenient way to import data from Excel to SPSS? Look no further! In this guide, we will walk you through the step-by-step process of smoothly transferring your data from Excel spreadsheets to the Statistical Package for the Social Sciences (SPSS). Whether you are a researcher, analyst, or student, SPSS is a widely-used software that allows you to perform various statistical analyses on your data. Importing data from Excel to SPSS can save you time and effort in manually inputting the data. So, let’s dive in and learn how to seamlessly import your Excel data into SPSS, unlocking the full potential of this powerful tool.
Inside This Article
- Step 1: Prepare Your Excel Data
- Step 2: Open SPSS and Create a New Data File
- Step 3: Import Excel Data into SPSS
- Step 4: Check and Modify Data Types and Variable Labels
- Step 5: Save Your SPSS Data File
- Step 6: Perform Data Analysis in SPSS
- Step 7: Export Results from SPSS to Excel
- Conclusion
- FAQs
Step 1: Prepare Your Excel Data
Before importing data from Excel to SPSS, it is essential to ensure that your Excel data is properly prepared to avoid errors and inconsistencies in the importing process. Here are some steps to follow:
1. Check for consistent naming conventions: Make sure that the column names in your Excel sheet are clear and consistent. Avoid using special characters or spaces in the column names, as this can cause issues when importing into SPSS.
2. Remove unwanted columns: If your Excel sheet contains columns that are not relevant for analysis in SPSS, it is advisable to remove them. This will help to keep your dataset clean and focused on the variables of interest.
3. Verify data formats: Check the data formats of your Excel columns. Ensure that numeric variables are formatted as numbers and text variables are formatted as text. SPSS relies on correct data formats for accurate analysis, so it is crucial to get this right.
4. Resolve missing data: Identify and deal with any missing data in your Excel sheet. Decide how to handle missing values, whether by imputation or exclusion from the analysis. Addressing missing values at this stage will save you time and effort later.
5. Clean up data: Remove any duplicate rows or problematic entries from your Excel sheet. Ensure that your data is accurate and free from any errors that may affect the analysis in SPSS.
6. Save your Excel file: Once you have prepared your Excel data, save the file in a location that is easily accessible. It is recommended to use a descriptive file name that reflects the content of your data.
By following these steps to prepare your Excel data, you will set a solid foundation for a smooth and error-free importing process into SPSS.
Step 2: Open SPSS and Create a New Data File
Once you have prepared your Excel data, it’s time to open SPSS and create a new data file. SPSS (Statistical Package for the Social Sciences) is a powerful software tool used for statistical analysis and data management. Follow these steps to get started:
1. Launch SPSS: Locate and open the SPSS software on your computer. Depending on your operating system, it may be found in your applications or programs folder. Double-click on the SPSS icon to open the software.
2. Create a New Data File: In the SPSS interface, click on “File” in the top menu bar and select “New” from the dropdown menu. This will open a new data file where you can import your Excel data.
3. Define Your Variables: In the new data file, you’ll need to define the variables that will hold your data. Variables can represent different categories or characteristics of your data, such as age, gender, or income. To define variables, click on “Type” in the menu bar and select the appropriate variable type (e.g., numeric, string, date) for each column in your data.
4. Set Variable Names and Labels: It’s important to provide clear and descriptive variable names that accurately represent the data they hold. To set variable names and labels, click on “Variable View” at the bottom of the SPSS interface. In the variable view, you can specify the names, labels, and properties of each variable in your data file.
5. Define Variable Properties: In addition to names and labels, you can also set other properties for your variables, such as measurement level, missing values, and value labels. These properties help SPSS interpret and analyze your data correctly. To define variable properties, click on each variable in the variable view and modify the respective properties in the “Properties” section.
6. Import Excel Data: Now that you have your data file set up and variables defined, it’s time to import your Excel data. Click on “File” in the menu bar and select “Open” from the dropdown menu. Find and select your Excel file in the file explorer window, and then choose the appropriate options for importing the data, such as selecting the sheet and range of cells to import. Once imported, your Excel data will appear in the Data View tab of the SPSS interface.
7. Save Your Data File: Finally, don’t forget to save your new SPSS data file. Click on “File” in the menu bar and select “Save As” from the dropdown menu. Choose a location on your computer where you want to save the file and give it a descriptive name. Saving your data file ensures that you can access and analyze your data in SPSS at a later time.
With these steps, you have successfully opened SPSS and created a new data file. Now you can proceed to the next steps of importing and analyzing your data in SPSS.
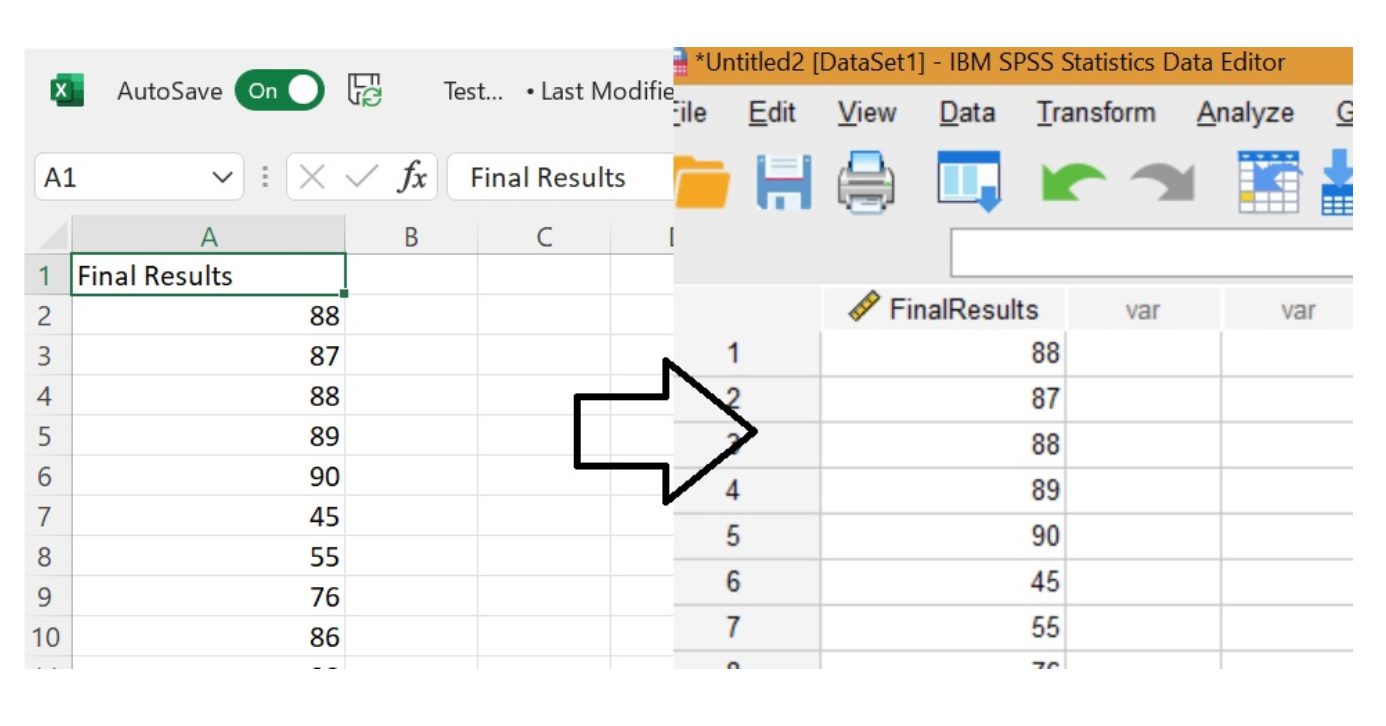
Step 3: Import Excel Data into SPSS
Once you have prepared your Excel data and opened SPSS, it’s time to import your Excel data into the SPSS software. This step is crucial as it allows you to start analyzing your data using the powerful tools and features provided by SPSS. To import Excel data into SPSS, follow the steps below:
1. Click on “File” in the top menu of your SPSS software, then select “Open” to open the dialog box.
2. In the dialog box, navigate to the location where your Excel file is saved, select the file, and click “Open.”
3. The “Text Import Wizard” will now appear on your screen. This wizard helps you define the settings for importing your Excel data into SPSS.
4. Choose the option “Import the data from an external file” and click “Next” to continue.
5. In the next window, select the file format as “Microsoft Excel” and click “Next.
6. The wizard will now give you the option to select a specific sheet from your Excel file if you have multiple sheets. Choose the sheet that contains the data you want to import and click “Next.”
7. In the following window, you will see a preview of your data. Here, you can review and make any necessary changes to the format of your variables, such as specifying that a column should be imported as a numeric variable. Once you are satisfied with the preview, click “Finish.”
8. You will now be prompted to enter a name for your data file in SPSS. Choose a descriptive name that will help you easily identify this data set later on. Click “OK.”
9. SPSS will import your Excel data and create a new data file with the specified name. You can now start working with your imported data and perform various analysis and statistical procedures using the tools provided by SPSS.
By following these simple steps, you can seamlessly import your Excel data into SPSS and unleash the full potential of SPSS for analyzing and interpreting your data.
Step 4: Check and Modify Data Types and Variable Labels
Once you have successfully imported your Excel data into SPSS, it is important to check and modify the data types and variable labels to ensure accuracy and clarity in your analysis. This step is crucial as it helps SPSS understand the nature of your data and enables you to perform appropriate statistical tests and calculations.
The first thing you should do is check the data types assigned to each variable. SPSS automatically assigns data types based on the content of each column in your Excel file. However, sometimes the default data type may not be suitable for your analysis. For example, if a variable contains numerical data, but SPSS has assigned it as a string, you need to change it to a numeric data type.
To modify the data type of a variable in SPSS, you can right-click on the variable name in the Variable View window and select “Variable Type”. From there, you can choose the appropriate data type, such as numeric, string, date, or time. Make sure to select the correct data type based on the nature of your data to avoid any inconsistencies in your analysis.
In addition to checking the data types, it is essential to review and update the variable labels. Variable labels provide a brief description or explanation of what the variable represents. This information is crucial for understanding your data and interpreting the results of your analysis.
To modify the variable labels in SPSS, you can right-click on the variable name in the Variable View window and select “Variable Labels”. Here, you can enter a concise and descriptive label that accurately represents the variable. It is recommended to use clear and meaningful labels to enhance the interpretability of your analysis.
Remember to save your changes after modifying the data types and variable labels. This ensures that the modifications are applied to your SPSS data file and will be reflected in any subsequent analyses or reports.
By checking and modifying the data types and variable labels in SPSS, you ensure that your data is appropriately categorized and accurately described. This step contributes to the overall integrity and reliability of your data analysis, allowing you to draw meaningful insights and make informed decisions based on your findings.
Step 5: Save Your SPSS Data File
Once you have imported and modified your data in SPSS, it is crucial to save your work to ensure that your analysis and changes are preserved. Saving your SPSS data file is a simple and straightforward process that offers you the flexibility to continue your analysis at a later time or share your data with others.
To save your SPSS data file, follow these steps:
- Click on the “File” menu in SPSS.
- Select the “Save” option from the drop-down menu.
- Choose a location on your computer where you want to save the file.
- Provide a name for your SPSS data file. It is recommended to choose a descriptive and meaningful name that reflects the content of your data.
- Specify the file format. SPSS allows you to save your data file in various formats, such as .sav, .por, or .xlsx.
- Click on the “Save” button to save the file.
By saving your SPSS data file, you ensure that all the changes you have made to your data, including modifications to variable labels, data types, and any analytical transformations, are preserved. Additionally, saving your data file in a specific format allows for easy compatibility with other statistical software or data analysis tools.
It is good practice to save multiple versions of your SPSS data file. For example, you can create a baseline version of your data file at the beginning of your analysis and save subsequent versions as you make additional modifications or conduct further analysis. This way, you can easily refer back to previous versions or compare results at different stages of your analysis.
Remember to regularly save your SPSS data file during the analysis process to prevent any potential loss of work in case of unexpected events, such as power outages or computer crashes.
Once your data file is saved, you can confidently proceed with your data analysis in SPSS, knowing that your work is secure and your modifications are preserved.
Step 6: Perform Data Analysis in SPSS
Once you have successfully imported your data into SPSS, you can now begin to perform data analysis. SPSS offers a wide range of statistical tools and techniques to analyze your data and uncover meaningful insights. Here are some key steps to guide you through the process:
1. Identify your research objectives: Before diving into the analysis, it is important to clearly define your research objectives. This will help guide the selection of appropriate analytical techniques and ensure that your analysis is focused and meaningful.
2. Explore your data: The first step in the analysis process is to explore your data. SPSS provides various tools such as descriptive statistics, frequency distributions, and data visualization to help you understand the distribution, central tendency, and variability of your variables. This exploratory analysis will give you insights into the characteristics of your data.
3. Conduct inferential statistics: After exploring your data, you can move on to conducting inferential statistics. This involves testing hypotheses and making inferences about the population based on your sample data. SPSS provides a range of statistical tests, including t-tests, ANOVA, regression analysis, and chi-square tests, among others.
4. Interpret the results: Once you have performed the analysis, it is crucial to interpret the results in the context of your research objectives. SPSS generates output tables and charts that present the statistical results in a clear and organized manner. Take the time to thoroughly examine the output and understand the implications of the findings.
5. Generate reports and visualizations: SPSS allows you to generate reports and visualizations of your analysis results. You can create tables, charts, and graphs to present your data and findings in a visually appealing manner. This will make it easier for others to understand and interpret the results of your analysis.
6. Validate and refine the analysis: It is important to validate your analysis by checking for outliers, influential cases, and potential errors. SPSS provides tools for identifying and handling such issues. Additionally, you may need to refine your analysis by conducting additional tests or exploring different variables to gain a deeper understanding of your data.
7. Communicate your findings: Finally, it is essential to effectively communicate your analysis findings to your audience. SPSS allows you to export your results in various formats, such as PDF, Word, Excel, or HTML. You can also copy and paste tables and charts into other applications for further customization.
By following these steps, you can harness the power of SPSS to gain valuable insights from your data and make informed decisions. Whether you are conducting academic research, business analysis, or any other data-driven project, SPSS provides a comprehensive platform for advanced data analysis and reporting.
Step 7: Export Results from SPSS to Excel
After performing data analysis in SPSS, you may want to export your results to Excel for further analysis or to share with others. Here is a step-by-step guide on how to export your results from SPSS to Excel:
Step 1: Once you have completed your data analysis in SPSS, go to the “File” menu and select “Save As”.
Step 2: In the “Save As” dialog box, navigate to the desired location where you want to save the Excel file. Name the file and choose the file format as “Microsoft Excel (*.xls)” or “Microsoft Excel (*.xlsx)” depending on your preference.
Step 3: Click on the “Save” button to export the results from SPSS to Excel.
Step 4: SPSS will prompt you to select the specific results you want to export. You can choose to export all the results or select specific tables or charts. Make your selection and click on the “OK” button.
Step 5: SPSS will convert the selected results into an Excel file and save it in the specified location. The exported file will maintain the formatting and structure of the original results.
Step 6: Once the export is complete, you can open the Excel file to further analyze or share the results with others. You can perform additional calculations, create charts, or apply other data manipulation techniques in Excel.
Step 7: It is important to note that when exporting results from SPSS to Excel, you should pay attention to any warnings or error messages that may appear. Sometimes, certain functions or formatting in SPSS may not be fully compatible with Excel, and you may need to make adjustments to ensure the accuracy and integrity of your data.
By following these steps, you can easily export your results from SPSS to Excel and continue your data analysis or share your findings with others in a familiar and widely used software program.
Conclusion
In conclusion, importing data from Excel to SPSS can be a straightforward process that allows you to harness the power of both tools to analyze and visualize your data effectively. By following the steps outlined in this guide, you can ensure a seamless transfer of data, saving time and effort in manual data entry.
Remember to format your Excel data correctly, including headers and variable names, to ensure accurate importation into SPSS. Additionally, take advantage of the various options available in SPSS to customize your data import, such as specifying data types and labels.
With the ability to handle large datasets and perform advanced statistical analysis, SPSS is a powerful tool for researchers, data analysts, and students alike. By mastering the skill of importing data from Excel to SPSS, you can unlock its full potential and make informed decisions based on your data.
So, next time you find yourself needing to import data from Excel to SPSS, you can tackle the task with confidence and efficiency, enabling you to gain valuable insights and make data-driven decisions with ease.
FAQs
1. Can I import data from multiple worksheets in Excel to SPSS?
Yes, you can import data from multiple worksheets in Excel to SPSS. SPSS allows you to select multiple worksheets during the import process, allowing you to merge data from different worksheets into a single SPSS dataset.
2. What file formats can I import from Excel to SPSS?
SPSS supports various file formats for importing data from Excel, including .xls, .xlsx, and .csv files. This gives you the flexibility to import data from different versions of Excel or export data from other software to SPSS.
3. Can I import variable labels and value labels from Excel to SPSS?
Yes, SPSS allows you to import variable labels and value labels from Excel. By assigning labels to variables and values in Excel, you can ensure that the imported data in SPSS retains the same meaningful labels, making it easier to analyze and interpret the data.
4. Is it possible to import data with missing values from Excel to SPSS?
Yes, you can import data with missing values from Excel to SPSS. During the import process, SPSS provides options to specify how you want missing values to be treated, such as assigning a specific value (e.g., “9999”) or identifying them as system-missing values. This ensures that the missing values are accurately represented in the SPSS dataset.
5. Do I need to have SPSS installed on my computer to import data from Excel?
Yes, in order to import data from Excel to SPSS, you need to have SPSS software installed on your computer. SPSS provides a user-friendly interface and various tools for data manipulation and analysis, making it a popular choice among researchers and data analysts.