
Finding the center of a data set is crucial for understanding and analyzing numerical information. Whether you’re working with a set of test scores, sales figures, or any other kind of data, knowing how to determine its center can provide valuable insights. The center of a data set is commonly represented by the mean, median, or mode. These measures help to summarize and make sense of the data by identifying its central tendency. In this article, we will explore different methods to find the center of a data set, explain when to use each measure, and provide step-by-step guidance on calculating them. By learning these techniques, you’ll be equipped to better interpret and draw conclusions from your data, whether for academic purposes, business analysis, or any other field that relies on quantitative data.
Inside This Article
- Overview of Data Sets
- Measures of Central Tendency
- Finding the Arithmetic Mean
- Calculating the Median of a Data Set
- Conclusion
- FAQs
Overview of Data Sets
A data set refers to a collection of values, observations, or measurements that are grouped together for analysis. In the field of data analysis, understanding the center of a data set is crucial as it provides valuable information about the typical or average value of the data. By determining the center, we can gain insights into the overall characteristics and tendencies of the data.
In this article, we will explore different methods to find the center of a data set. These methods include calculating the mean, median, mode, and midrange. Each of these measures provides a unique perspective on the central value of the data and can reveal different aspects of the data set’s distribution.
The mean, often referred to as the average, is calculated by summing all the values in the data set and dividing the sum by the total number of values. This measure is sensitive to extreme values, as it takes into account every value in the data set. The mean is widely used and provides a good overall representation of the data if there are no extreme outliers.
The median is the middle value in a data set when it is ordered from smallest to largest. If the data set has an odd number of values, the median is simply the middle value. However, if there is an even number of values, the median is the average of the two middle values. The median is a robust measure of central tendency that is not influenced by outliers and is particularly useful when dealing with skewed data sets.
The mode represents the most frequently occurring value in a data set. Unlike the mean and median, the mode can be used with both numerical and categorical data. In some cases, a data set may have multiple modes, indicating that there is more than one value that occurs with the highest frequency.
The midrange is calculated by finding the average of the maximum and minimum values in a data set. While the midrange can provide a quick approximation of the center, it is less commonly used than the mean, median, and mode.
By utilizing these methods, we can gain a comprehensive understanding of the center of a data set. Depending on the characteristics of the data and the goals of the analysis, different measures of central tendency may be more appropriate. It is important to consider the nature of the data and choose the method that best aligns with the research question at hand.
Measures of Central Tendency
When analyzing a data set, it is often useful to determine its “center,” or the value that represents the typical or average value. Measures of central tendency allow us to summarize and understand the overall trend of the data. The three main measures of central tendency are the mean, median, and mode.
Mean: The mean, often referred to as the average, is calculated by summing all the values in a data set and dividing by the number of values. It gives us an idea of the “average” value in the data set. To find the mean, add up all the values and divide by the total number of values. For example, if we have the data set “5, 7, 9, 11, 13,” the mean would be (5 + 7 + 9 + 11 + 13) / 5, which equals 9.
Median: The median is the middle value in a data set when the values are arranged in ascending or descending order. It is useful when dealing with skewed data sets or outliers that may significantly impact the mean. To find the median, first arrange the data set in order. If the data set has an odd number of values, the median is the middle value. If the data set has an even number of values, the median is the average of the two middle values. For example, the median of the data set “2, 4, 7, 9, 11, 15” would be 7.
Mode: The mode is the value that appears most frequently in a data set. It is useful for identifying the most common value or values in the data. Unlike the mean and median, the mode does not necessarily have a unique value; a data set can have multiple modes or no mode at all. In the data set “2, 4, 6, 6, 9, 9,” the mode is 6 and 9 since they both appear twice, while in the data set “1, 3, 5, 7,” there is no mode.
Midrange: The midrange is the average of the maximum and minimum values in a data set. It provides a simple measure of central tendency and is less affected by extreme values compared to the mean or median. To calculate the midrange, add the maximum and minimum values and divide by 2. For example, in the data set “8, 12, 15, 21, 34,” the midrange would be (34 + 8) / 2, which equals 21.
Finding the Arithmetic Mean
When analyzing a data set, one of the key metrics to determine its central tendency is the arithmetic mean. The arithmetic mean, commonly referred to as the average, is calculated by summing up all the values in the data set and dividing the total by the number of values.
To find the arithmetic mean, follow these steps:
- Start by adding up all the values in the data set.
- Count the total number of values in the data set.
- Divide the sum of the values by the total number of values.
Here’s an example to illustrate how to find the arithmetic mean:
Imagine you have a data set of exam scores:
75, 80, 90, 85, 95
To find the arithmetic mean, you would sum up all the scores:
75 + 80 + 90 + 85 + 95 = 425
Next, count the number of scores:
There are 5 scores in total.
Finally, divide the sum by the number of scores:
425 / 5 = 85
Therefore, the arithmetic mean of the exam scores is 85.
The arithmetic mean is a valuable tool for summarizing a data set and gaining insights. It represents the average value of the entire data set and provides a measure of central tendency.
It’s important to note that the arithmetic mean can be affected by extreme values, also known as outliers. Outliers are values that significantly deviate from the rest of the data, and they can have a disproportionate impact on the mean.
Overall, finding the arithmetic mean is a straightforward process that allows you to determine the average value in a data set efficiently. By using this measure of central tendency, you can gain a better understanding of the overall trend in your data.
Calculating the Median of a Data Set
When analyzing a data set, one of the key measures used to find the center is the median. The median represents the middle value of a data set when it is arranged in ascending or descending order. Unlike the mean, which may be affected by extreme values, the median provides a more robust measure of central tendency.
To calculate the median of a data set, follow these steps:
- Arrange the data set in ascending or descending order.
- If the data set has an odd number of values, the median is the middle value.
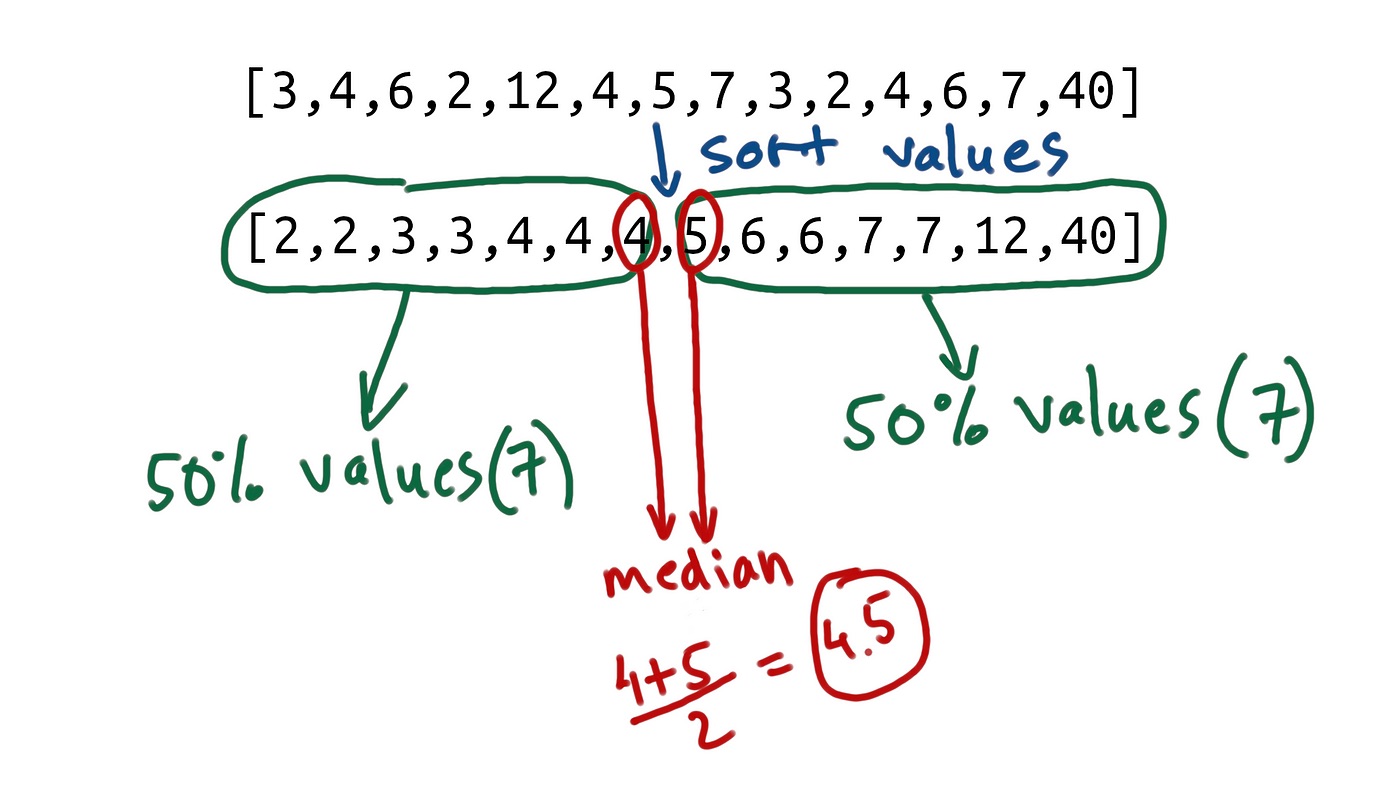
- If the data set has an even number of values, the median is the average of the two middle values.
Let’s look at an example to illustrate how to calculate the median:
Consider the following data set: 4, 7, 9, 10, 12, 15, 20
Step 1: Arrange the data set in ascending order: 4, 7, 9, 10, 12, 15, 20
Step 2: Since the data set has an odd number of values, the middle value is the median. In this case, the median is 10.
Now, let’s consider a data set with an even number of values:
Consider the following data set: 3, 4, 6, 8, 10, 12
Step 1: Arrange the data set in ascending order: 3, 4, 6, 8, 10, 12
Step 2: Since the data set has an even number of values, we need to find the average of the two middle values. In this case, the middle values are 6 and 8. Therefore, the median is (6 + 8) / 2 = 7.
The median is a valuable measure to find the center of a data set because it is not influenced by extreme values and provides a representative value that is in the middle of the data.
Conclusion
In conclusion, finding the center of a data set is a fundamental concept in statistics that allows us to understand where the most typical or average value lies. By calculating measures of central tendency such as the mean, median, and mode, we can gain insights into the distribution and characteristics of the data.
The mean represents the arithmetic average of the data and is useful when dealing with numerical values. The median is the middle value of the data, which is handy when tackling skewed distributions. The mode is the most frequently occurring value and is helpful for identifying the most common element in the data set.
By understanding how to find the center of a data set, we can make informed decisions, draw meaningful conclusions, and analyze information effectively. Whether we are analyzing sales data, survey responses, or scientific observations, determining the center is a crucial step in data analysis that empowers us to extract valuable insights and make informed decisions.
FAQs
1. What is the center of a data set?
The center of a data set refers to the middle or average value of the data points. It is used to provide a measure of central tendency and is often used as a summary statistic.
2. How do you find the center of a data set?
To find the center of a data set, you can use various measures such as the mean, median, and mode. The mean is calculated by summing up all the data points and dividing it by the total number of data points. The median is the middle value when the data set is arranged in ascending or descending order. The mode is the value that appears most frequently in the data set.
3. Why is it important to find the center of a data set?
Finding the center of a data set is important because it provides valuable insights into the overall distribution and characteristics of the data. It helps identify the typical or average value, which can be used for making comparisons, analyzing trends, and making informed decisions.
4. Is the mean always the best measure of center?
No, the mean is not always the best measure of center, especially when there are outliers or extreme values in the data set. Outliers can significantly impact the mean value, creating a skewed representation of the data. In such cases, the median might be a more appropriate measure of center as it is less affected by outliers.
5. Which measure of center should I use?
The choice of measure of center depends on the nature of the data and the question you are trying to answer. If the data is normally distributed without outliers, the mean can be an appropriate measure. However, if the data is skewed or contains outliers, the median or mode might be more suitable. It is important to consider the context and purpose of the analysis to make an informed decision.