




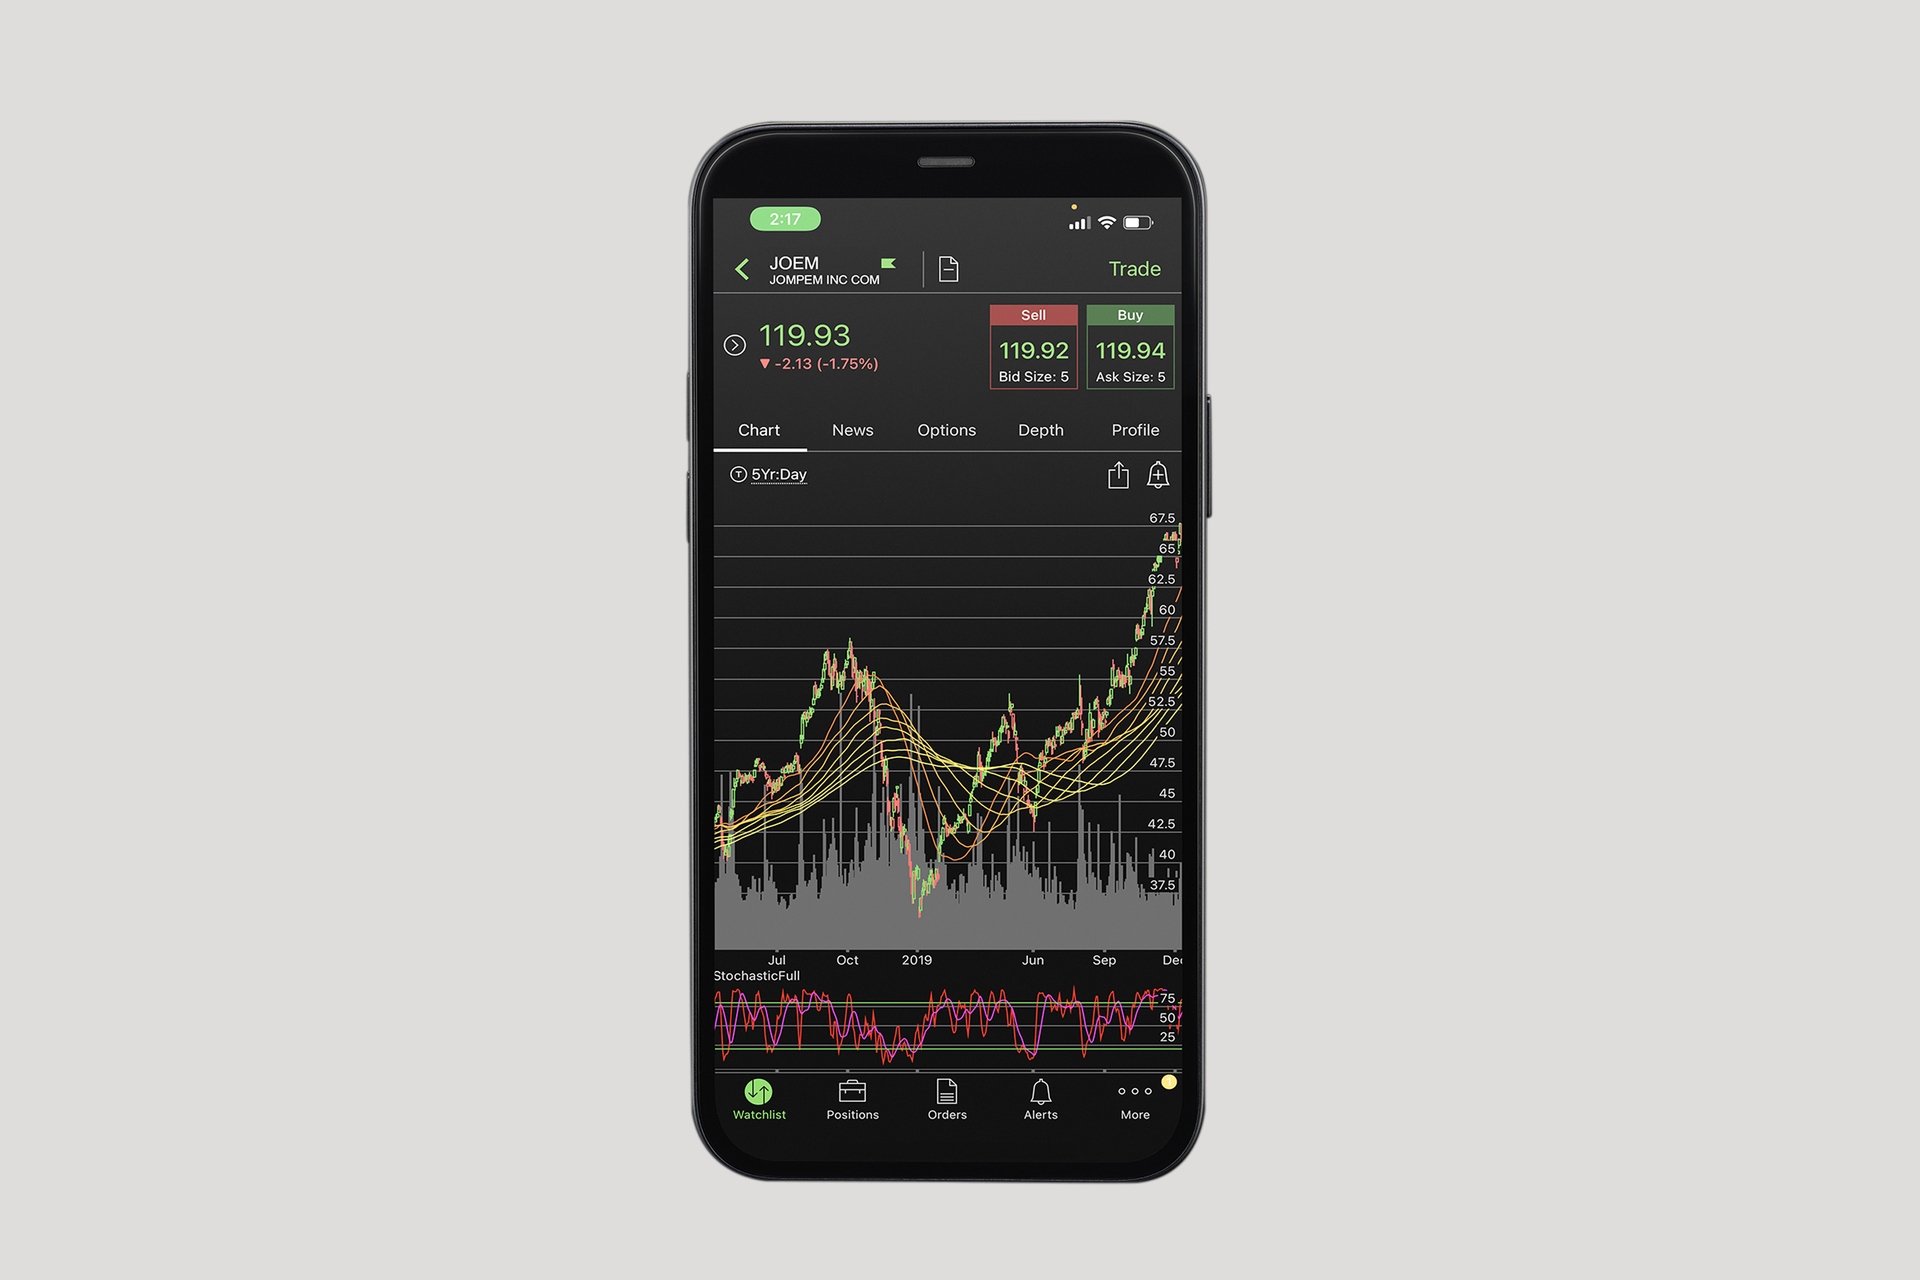
To view an options chart on thinkorswim mobile, open a standard chart for the desired option contract from your watchlist or positions screen, then access Chart Settings to configure options-specific display preferences. This process lets you analyze an option's price history and apply technical indicators directly from your phone.
Opening a chart for an option contract
Navigate to your watchlist or positions screen and tap the option symbol to open its detail view. From there, select the chart icon to display the price chart for that specific contract. This gives you immediate access to the price action of the option itself, separate from the underlying stock.
Accessing chart settings for options data
Tap the settings icon on the chart screen, then select Chart Settings. Inside, go to the Options tab where all option-specific display controls are located. This is the central hub for customizing how option data appears on your chart, similar to how you would adjust maps and navigation app settings to change your route display.
Choosing the price type for your option chart
In the Options tab, select Last, Ask, Bid, or Mark as the price type for your chart. Note that Ask, Bid, and Mark are only available for intraday charts with time intervals of 15 days or less. Choosing the right price type helps you see the actual traded price or the current market maker quotes, depending on your analysis needs.
Displaying open interest and theoretical price
Enable Show open interest to add the Open Interest study to the Volume subgraph; this plot appears only if Show studies is enabled on the General tab. Toggle Show theo price to display the Theoretical Option Price plot on the main subgraph. These studies give you insight into market activity and the fair value estimate of the option.
Adding volume and extended-hours data
Enable Show volume subgraph to display the volume histogram directly on your chart. Use Show Extended-Hours Trading session to view pre-market and after-hours activity on intraday charts, and turn on Highlight Extended-Hours Trading session to color that session differently. This helps you see where liquidity and price movement occurred outside regular market hours.
Applying technical indicators to your option chart
With over 300 available technical studies, you can add indicators like moving averages or RSI from the studies menu to analyze option price trends and volatility. These indicators work on the option's price data just as they do on stock charts, helping you identify momentum, support, and resistance levels for your options trades.
Saving your customized option chart layout
Save your configured chart as a template for quick access to the same options display settings across different contracts. This means you don't have to reconfigure price type, studies, and subgraphs every time you switch to a new option; simply load your saved template and start analyzing.
Frequently Asked Questions
Can I view an options chart directly from the option chain on thinkorswim mobile?
Are the options chart settings the same on iPhone and Android?
Why can't I select Ask, Bid, or Mark as my price type?
These price types are only available for intraday charts with a time interval of 15 days or less. If your chart is set to a daily or longer timeframe, only the Last price type will be available.
Does the open interest study require any other settings to be enabled?
Yes, the Open Interest plot on the Volume subgraph appears only if Show studies is enabled on the General tab of Chart Settings. You must turn on that general setting first for the open interest data to display.
Can I save my options chart layout and use it on the desktop version?
Yes, thinkorswim mobile gives access to synced preferences and settings from thinkorswim desktop, so a chart template saved on mobile can be loaded on the desktop platform and vice versa.