
Excel is a powerful spreadsheet tool that is widely used for data analysis and organization. It offers many features and functionalities that allow users to work with large amounts of data efficiently. Working with large data sets in Excel can be a daunting task, but with the right techniques and strategies, you can navigate and manipulate data with ease. In this article, we will explore various methods and tips for effectively handling and managing large data sets in Excel. Whether you are a beginner or an experienced Excel user, these techniques will help you improve productivity and make the most of your data analysis tasks. So, let’s dive in and discover the key steps and best practices for working with large data sets in Excel!
Inside This Article
- Understanding large data sets in Excel
- Importing and cleaning large data sets
- Working with filters and sort options for large data sets in Excel
- Using pivot tables to analyze large data sets in Excel
- Creating visualizations and charts from large data sets in Excel
- Utilizing Excel’s data analysis tools for large data sets
- Tips and tricks for effectively working with large data sets in Excel
- Conclusion
- FAQs
Understanding large data sets in Excel
In today’s data-driven world, dealing with large data sets has become increasingly common. Excel, with its powerful features and functionality, is a popular tool for managing and analyzing these vast amounts of data. But before diving into the complexities of working with large data sets in Excel, it’s important to understand what exactly constitutes a “large” data set and the challenges it presents.
A large data set typically refers to a collection of information that exceeds the capacity of a standard Excel worksheet. This could mean thousands, or even millions, of rows and columns of data. Analyzing and manipulating such massive amounts of data can be a daunting task without the right strategies and tools.
One of the main challenges when working with large data sets in Excel is performance. As the volume of data increases, so does the processing time required for calculations, sorting, and filtering. This can lead to sluggish performance and make it difficult to extract meaningful insights efficiently.
Another challenge is data organization. With a large data set, it’s essential to have a well-structured layout to ensure easy navigation and analysis. This means properly labeling headers, using consistent formatting, and grouping related data together. Organizing data effectively simplifies the task of filtering, summarizing, and visualizing the information.
Accuracy and data integrity are also key considerations when dealing with large data sets. As the amount of data grows, the likelihood of errors or inconsistencies increases. It’s crucial to have robust data validation procedures in place to identify and fix any inconsistencies, such as missing values, duplicates, or incorrect formulas.
Lastly, storage and memory management are important factors to keep in mind. Large data sets can take up a significant amount of storage space, especially if there are multiple versions or backups. Excel has its limitations in terms of memory and processing capacity, so it’s essential to optimize your workbook by minimizing unnecessary calculations and utilizing efficient formulas.
Understanding these challenges is the first step towards effectively working with large data sets in Excel. With the right strategies and tools, such as importing and cleaning data, using filters and sort options, utilizing pivot tables and data analysis tools, and creating visualizations, you can transform raw data into actionable insights.
Importing and cleaning large data sets
Importing and cleaning large data sets in Excel is a crucial step in preparing the data for analysis. Dealing with a large amount of data can be overwhelming, but with the right techniques, you can efficiently import and clean your data to ensure its accuracy and usability.
The first step in importing a large data set into Excel is to ensure that the data is in a compatible format. This may involve converting the file to a CSV (comma-separated values) format or ensuring that the data is properly structured with consistent column headers. Once the data is in the correct format, you can begin the importing process.
Excel offers various methods of importing data, such as using the “Get External Data” feature, which allows you to import data from different sources like databases or text files. You can also copy and paste the data directly into Excel, or use the “Import Wizard” to guide you through the import process.
Once your data is imported, the next step is to clean the data to remove any inconsistencies or errors. This involves handling missing values, correcting formatting issues, and removing any unnecessary characters or spaces. Excel provides several tools and functions that can help you clean your data effectively.
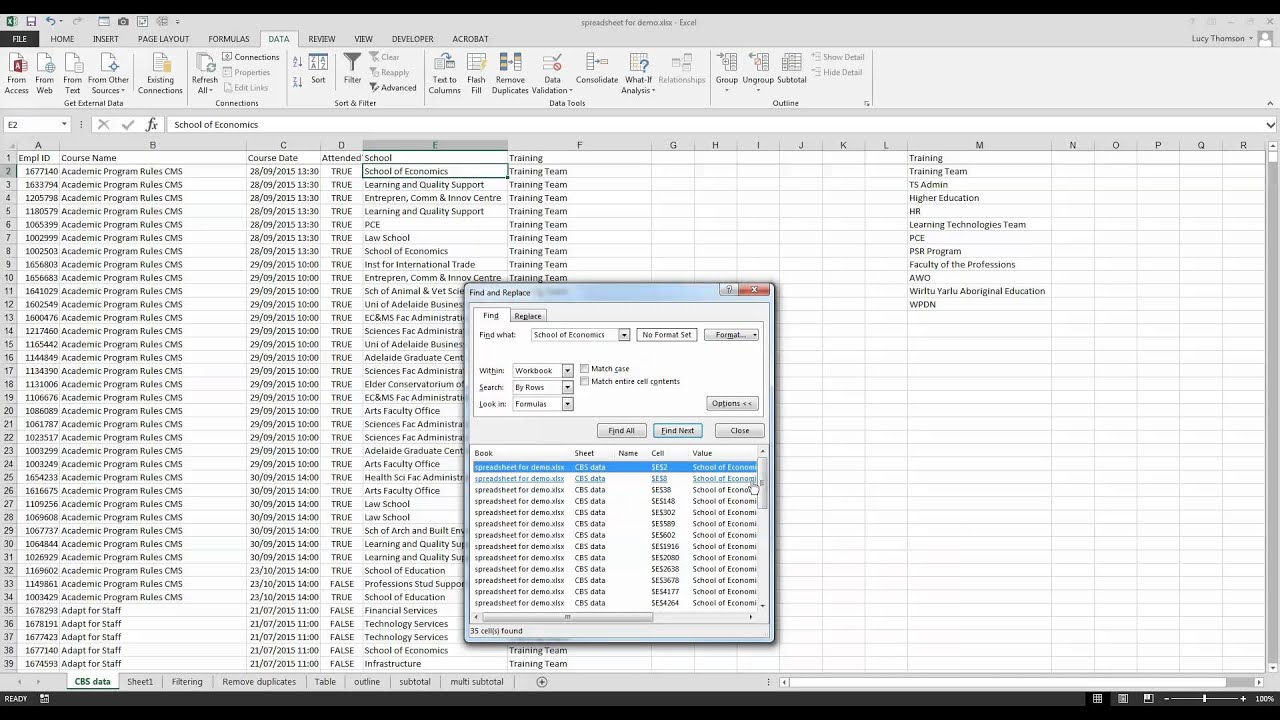
One useful tool for cleaning data is Excel’s “Find and Replace” feature. This allows you to search for specific values or patterns within your data and replace them with the desired values. For example, if your data contains misspelled company names, you can use the “Find and Replace” feature to correct them quickly.
In addition to the “Find and Replace” feature, Excel also offers functions like “TRIM” and “CLEAN” that can remove leading or trailing spaces and non-printable characters from your data. These functions are particularly useful when dealing with large data sets where inconsistencies in formatting are common.
Another important aspect of data cleaning is handling missing values. Large data sets often have missing values, which can affect the accuracy of your analysis. Excel provides functions like “IF” and “ISBLANK” that can help you identify and handle missing values. By using these functions, you can either replace missing values with a suitable alternative or exclude the rows or columns with missing values from your analysis.
Working with filters and sort options for large data sets in Excel
When dealing with large data sets in Excel, it becomes essential to have efficient tools for filtering and sorting the data. Filters allow you to narrow down the data based on specific criteria, while sort options help organize the data in a meaningful way. Let’s explore how to work with filters and sort options to manage large data sets effectively.
1. Applying filters:
Filters in Excel make it easy to view subsets of data that meet certain conditions. To apply a filter, select the range of data and then click on the “Filter” button in the “Data” tab of the Excel ribbon. This will add filter dropdowns to each column header. You can use these dropdowns to select specific values or apply custom criteria to filter the data.
2. Using multiple filters:
If your data has multiple columns, you can apply filters to multiple columns simultaneously. To do this, click on the filter dropdown of one column, select the desired criteria, and then repeat the process for other columns. Excel will automatically apply the filters in combination, showing only the data that meets all the filter conditions.
3. Sorting data:
Sorting your data helps arrange it in a particular order based on column values. Excel provides various sorting options, such as sorting in ascending or descending order, sorting by multiple columns, or custom sorting based on specific criteria. To sort data, select the range of data and click on the “Sort” button in the “Data” tab. Choose the column you want to sort by, select the sorting options, and click “OK”.
4. Filtering and sorting together:
Combining filters and sorting allows you to analyze your data more effectively. You can first apply filters to narrow down the data to a subset, and then sort that filtered data to reveal patterns or trends. This helps you focus on specific segments of your data while maintaining the desired order.
5. Clearing filters and sort:
To remove filters, click on the filter dropdown in the column header and select the “Clear Filter” option. To remove sorting, select the range of data and click on the “Sort” button in the “Data” tab. Choose the “Clear” option to remove any existing sorting settings.
Working with filters and sort options in Excel is crucial for managing large data sets efficiently. By applying filters and sorting, you can extract valuable insights and make data-driven decisions more effectively. Experiment with different filter criteria and sorting options to discover patterns and trends within your data.
Using pivot tables to analyze large data sets in Excel
When dealing with large data sets in Excel, one of the most effective tools at your disposal is pivot tables. Pivot tables allow you to analyze and summarize vast amounts of data in a concise and organized manner. They provide a visual representation of data, making it easier to identify patterns, trends, and key insights.
Creating a pivot table in Excel is a relatively simple process. Start by selecting the dataset you want to analyze, then go to the “Insert” tab and click on “PivotTable.” Choose the range of the data and the location where you want the pivot table to be placed.
Once you have created the pivot table, Excel provides a plethora of options to arrange and analyze the data. You can drag and drop columns into the “Rows” area to group the data by specific categories. Similarly, you can place columns in the “Columns” area to create a matrix-like view of the data.
After arranging the data, you can use the “Values” area to perform calculations and aggregations on the data. Excel offers various functions such as sum, count, average, min, max, etc. that can be applied to the values in the pivot table.
One of the greatest strengths of pivot tables is their ability to quickly generate summaries and insights from large data sets. By simply dragging and dropping different fields into the pivot table, you can create multiple levels of analysis and view the data from different perspectives.
Pivot tables also allow you to apply filters and sorting options to further refine your analysis. Excel provides a range of filter options, such as filtering by specific values, creating custom filters, or using advanced filters. Sorting the data in ascending or descending order can also help in identifying top values or trends within the data set.
In addition to filtering and sorting, pivot tables enable you to create calculated fields and calculated items. Calculated fields allow you to perform mathematical operations on existing data fields, while calculated items allow you to combine or modify existing data items. These features give you the flexibility to derive new insights and metrics from your data.
Visualizing the data is another powerful feature of pivot tables. Excel allows you to create pivot charts directly from the pivot table to present data in a graphical format. This visual representation can make it easier to understand complex relationships and trends within the data.
Overall, pivot tables are an indispensable tool for analyzing large data sets in Excel. They provide a flexible and efficient way to summarize, analyze, and visualize data. By mastering the art of pivot tables, you can uncover valuable insights and make data-driven decisions with ease.
Creating visualizations and charts from large data sets in Excel
Visualizations and charts are powerful tools for analyzing and presenting data in a clear and meaningful way. In Excel, you can create a wide range of visualizations and charts to gain insights from your large data sets. Here are some techniques to help you make the most of this capability.
1. Choose the right chart type: Excel offers various types of charts, such as bar charts, line charts, pie charts, and more. Consider the nature of your data and the message you want to convey to determine the most suitable chart type. For example, if you want to compare different categories, a bar chart would be ideal, while a line chart is useful for showing trends over time.
2. Highlight key data points: When dealing with large data sets, it’s important to focus on the essential information. Use Excel’s formatting options to highlight or emphasize key data points in your chart. This can be done by changing the color, size, or style of specific data series or individual data points.
3. Utilize data labels and tooltips: To provide additional context and details, consider adding data labels or tooltips to your chart. Data labels display specific values or labels for each data point, making it easier for viewers to interpret the chart. Tooltips can be used to display additional information when hovering over specific data points.
4. Combine multiple chart types: Sometimes, displaying data using a single chart type may not be sufficient to convey complex relationships or patterns. In such cases, you can combine multiple chart types in Excel. For example, you can create a combination chart that includes both a line chart and a bar chart, allowing you to visualize different aspects of your data simultaneously.
5. Use interactive features: Excel provides interactive features that allow users to explore data in-depth. For instance, you can add slicers or drop-down menus to your chart, enabling users to filter and analyze the data based on specific criteria. This interactivity enhances the user experience and facilitates better understanding of the data.
6. Incorporate conditional formatting: Conditional formatting is a powerful feature in Excel that allows you to highlight data based on certain conditions. You can apply conditional formatting to your charts to draw attention to specific data points or trends. By using color scales, data bars, or icon sets, you can create visual cues that reflect the magnitude or significance of the data.
7. Refresh data and automate updates: Large data sets are often dynamic, with new data being added or existing data changing over time. Excel provides options to refresh your data and automate updates in your charts. By setting up data connections or using Excel’s Power Query feature, you can ensure that your visualizations and charts are always up-to-date without the need for manual intervention.
By following these tips and utilizing the features available in Excel, you can create compelling visualizations and charts from your large data sets. Remember to consider your audience and the insights you want to convey, and experiment with different chart types and customization options to effectively present your data.
Utilizing Excel’s data analysis tools for large data sets
When it comes to working with large data sets in Excel, having the right tools at your disposal is crucial. Excel offers a wide range of built-in data analysis tools that can help you make sense of your data and extract valuable insights. In this section, we’ll explore some of the powerful data analysis features that Excel has to offer.
One of the most popular data analysis tools in Excel is the “PivotTable” feature. PivotTables allow you to summarize and analyze large amounts of data quickly and efficiently. You can use PivotTables to group and filter data, calculate totals and subtotals, and create custom calculations. By simply dragging and dropping fields, you can easily transform a complex data set into a manageable and comprehensible report.
Another useful tool for analyzing large data sets in Excel is the “Data Analysis Toolpak”. This add-in enables you to perform advanced statistical analysis and calculations. With the Data Analysis Toolpak, you can run regression analysis, perform hypothesis testing, calculate moving averages, and much more. This toolpak is essential for users who need to dive deeper into the statistical aspects of their data sets.
Excel also provides powerful visualization tools for large data sets. The “Charts” feature allows you to create various types of charts, such as bar graphs, line graphs, and pie charts, to represent your data visually. Visualizations not only make it easier to understand the data but also make it more engaging and impactful when presenting your findings to others.
In addition to PivotTables and visualizations, Excel offers other data analysis functions like “What-If Analysis”, “Scenario Manager”, and “Solver”. These tools enable you to analyze different scenarios and optimize your data based on specific goals or constraints. Whether you need to perform sensitivity analysis, goal seeking, or optimization, Excel provides the necessary functionality to accomplish these tasks efficiently.
Furthermore, Excel allows you to create custom macros and automate repetitive data analysis tasks. With Visual Basic for Applications (VBA), you can write code to perform complex calculations, automate data cleaning processes, and create custom functions. This level of automation not only saves time but also ensures consistency and accuracy in your data analysis workflow.
So, if you are working with large data sets in Excel, make sure to take advantage of these powerful data analysis tools. Whether it’s summarizing data with PivotTables, running advanced statistical analysis with the Data Analysis Toolpak, creating visualizations, or automating tasks with macros, Excel has everything you need to analyze and gain valuable insights from your data.
Tips and tricks for effectively working with large data sets in Excel
Working with large data sets in Excel can be a challenging and time-consuming task. However, with the right tips and tricks, you can streamline your workflow and make the process much more efficient. Here are some strategies to help you effectively work with large data sets in Excel:
1. Use filters and sorting: Excel has built-in features that allow you to easily filter and sort your data. Use these tools to quickly find specific information or organize your data in a way that makes sense to you.
2. Split your data into manageable chunks: If your data set is too large to work with comfortably, consider breaking it down into smaller, more manageable chunks. This will make it easier to navigate and perform calculations on specific sections of the data.
3. Utilize formulas and functions: Excel offers a wide range of formulas and functions that can help you analyze and manipulate your data. Take the time to learn and understand these functions, as they can greatly simplify complex calculations.
4. Use pivot tables: Pivot tables are a powerful tool for summarizing and analyzing large data sets. They allow you to quickly group and categorize data, making it easier to identify patterns and trends.
5. Enable data validation: Excel’s data validation feature allows you to set specific criteria for data entry, preventing errors and ensuring data integrity. This is especially important when working with large data sets, as errors can have significant consequences.
6. Use conditional formatting: Conditional formatting allows you to apply formatting rules to your data based on certain criteria. This can help you visually highlight important information or identify outliers in your data set.
7. Take advantage of Excel’s data analysis tools: Excel offers various data analysis tools such as regression analysis, goal seek, and scenario manager. Explore these tools to gain deeper insights into your data and perform advanced calculations.
8. Use keyboard shortcuts: Excel has a range of keyboard shortcuts that can save you time and make your work more efficient. Take the time to familiarize yourself with these shortcuts, as they can significantly speed up your data analysis process.
9. Regularly save your work: When working with large data sets, it’s important to save your work frequently to avoid losing any changes or progress. Excel provides an autosave feature, but it’s always a good idea to manually save your work as well.
10. Use the “Power Query” feature: Excel’s Power Query feature allows you to connect, combine, and transform data from multiple sources. This is particularly useful when dealing with large and complex data sets that require data cleansing and transformation.
By implementing these tips and tricks, you can optimize your workflow and effectively work with large data sets in Excel. Remember to experiment with different techniques and find what works best for your specific data analysis needs.
Conclusion
In conclusion, working with large data sets in Excel can be a challenging task. However, by implementing the techniques and strategies discussed in this article, you can effectively manage and analyze large amounts of data with ease.
Remember to optimize your Excel file by utilizing features such as filtering, sorting, and conditional formatting. This will help you easily navigate through the data and identify patterns and trends.
Additionally, consider using external tools and add-ins to enhance Excel’s capabilities, such as Power Query for data extraction and transformation, or Power Pivot for advanced analysis and modeling.
Lastly, don’t forget the importance of regularly saving your work and backing up your data to prevent any loss or corruption. With these guidelines in mind, you’ll be well-equipped to tackle even the largest data sets and make informed decisions based on your findings.
FAQs
Q: Can Excel handle large data sets?
A: Yes, Excel can handle large data sets. Its size limit is determined by your computer’s memory and the version of Excel you are using. In newer versions of Excel, you can work with data sets that contain millions of rows and thousands of columns. However, it is essential to optimize your Excel file to ensure smooth performance when dealing with large data sets.
Q: How can I optimize my Excel file for large data sets?
A: To optimize your Excel file for large data sets, you can take several steps. First, avoid unnecessary formatting and conditional formatting, as they can slow down performance. Secondly, use efficient formulas and avoid volatile functions that recalculate every time a change is made. Additionally, you can disable automatic calculations and enable manual calculation mode. Finally, consider splitting your data into multiple worksheets or using Power Query to load and transform data externally for better performance.
Q: What are some useful Excel functions for working with large data sets?
A: Excel offers several powerful functions that are particularly useful for working with large data sets. Some of these functions include VLOOKUP and INDEX/MATCH for looking up values, SUMIFS and COUNTIFS for summarizing data based on specific criteria, and SUBTOTAL for calculating subtotals within filtered data. The SUMPRODUCT function can also be beneficial for performing calculations on large arrays of data.
Q: Is there a way to speed up Excel calculations for large data sets?
A: Yes, there are techniques to speed up Excel calculations for large data sets. One approach is to turn off automatic calculations and manually recalculate the workbook only when needed. Another method is to use array formulas sparingly, as they can significantly slow down calculations. Additionally, you can optimize your formulas by using the most efficient functions available and avoiding volatile functions that recalculate unnecessarily.
Q: Are there any alternatives to Excel for working with large data sets?
A: Yes, there are alternative tools to Excel that are specifically designed for handling large data sets. Some popular options include Apache Hadoop, Apache Spark, and Python libraries like Pandas and NumPy. These tools offer more advanced capabilities for data manipulation, analysis, and processing. However, Excel can still be a practical and accessible choice for working with moderately sized data sets or for quick and simple data analysis tasks.