
Are you feeling overwhelmed by the vast amount of data you’ve collected for your research? Don’t worry, you’re not alone. Analyzing data can be a daunting task, especially if you’re not familiar with the right tools and techniques. But fear not, as we’re here to help you navigate the world of data analysis using SPSS.
SPSS (Statistical Package for the Social Sciences) is a powerful software program commonly used by researchers and data analysts to analyze and interpret data. It offers a wide range of statistical procedures and tools that enable you to explore and make sense of your data.
In this article, we’ll guide you through the process of analyzing data in SPSS, from importing and cleaning your data to running statistical tests and generating insightful visualizations. So, grab a cup of coffee and let’s dive into the world of data analysis with SPSS!
Inside This Article
- SPSS: A Brief Overview
- Importing Data into SPSS
- Data Cleaning and Preparation
- Descriptive Statistics and Frequency Analysis
- Explore and Analyze Relationships
- Conducting Statistical Tests
- Creating Charts and Graphs
- Reporting and Interpreting Results
- Conclusion
- FAQs
SPSS: A Brief Overview
SPSS (Statistical Package for the Social Sciences) is a widely-used software tool for statistical analysis and data management. It provides a user-friendly interface that allows researchers, analysts, and data scientists to explore, visualize, and analyze data from various sources.
With SPSS, you can import data from different file formats such as Excel, CSV, and databases. It supports a wide range of statistical techniques, from simple descriptive statistics to advanced modeling and predictive analytics.
SPSS offers a comprehensive set of tools and features that enable users to perform various data manipulation tasks. This includes data cleaning, transformation, recoding, and merging datasets.
One of the key strengths of SPSS is its ability to generate descriptive statistics and conduct frequency analysis. You can easily calculate measures of central tendency, dispersion, and explore the distribution of variables in your dataset. SPSS also allows you to generate tables and charts to visualize the frequency of categories or levels within a variable.
Another powerful feature of SPSS is its capability to explore and analyze relationships between variables. This includes conducting correlation analysis, cross-tabulations, and creating scatterplots or bar charts to visualize the relationship between two or more variables.
SPSS also supports a wide range of statistical tests, including t-tests, ANOVA, chi-square tests, regression analysis, and factor analysis. These tests enable researchers to examine the significance of relationships, test hypotheses, and make informed decisions based on the data.
In addition to statistical analysis, SPSS provides a rich set of graphing and charting tools that allow you to create various types of charts and graphs, such as histograms, pie charts, line plots, and more. These visual representations can help you communicate your findings effectively and make your data more accessible to others.
Lastly, SPSS offers features for reporting and interpreting results. You can generate customizable reports, tables, and charts that can be exported to different formats like Word, Excel, or PowerPoint. This enables you to present your findings in a clear and concise manner, making it easier for stakeholders and decision-makers to understand and act upon the results.
Importing Data into SPSS
Importing data into SPSS is a crucial step in the data analysis process. SPSS, which stands for Statistical Package for the Social Sciences, is a powerful software tool used by researchers and analysts to analyze and interpret data. Whether you have data stored in Excel, CSV, or any other format, SPSS provides a user-friendly interface to import and work with your datasets.
In order to import data into SPSS, you can follow these simple steps:
- Open SPSS on your computer.
- Click on “File” in the top menu and select “Open” from the dropdown menu.
- Navigate to the location where your data file is stored.
- Choose the appropriate data file format, such as Excel or CSV, from the file type dropdown menu.
- Select the desired dataset from the list and click on “Open.”
Once you have successfully imported your data into SPSS, you will see the dataset displayed in the SPSS data editor window. This editor provides a comprehensive view of your data, including the variable names, data values, and variable types.
It is important to note that SPSS has certain limitations when it comes to importing data. For instance, it has a maximum limit on the number of variables and cases it can handle. Additionally, SPSS may encounter issues with data formats and encoding. In such cases, it is recommended to preprocess the data in a compatible format before importing it into SPSS.
Furthermore, while importing the data, SPSS allows you to define the properties of your variables, such as the measurement level (nominal, ordinal, interval, or ratio) and the variable labels. This step is crucial for ensuring accurate analysis and interpretation of the data.
Overall, importing data into SPSS is a simple process that enables you to access and work with your datasets effectively. By following the steps outlined above, you can easily import your data and begin your data analysis journey using the robust features and capabilities of SPSS.
Data Cleaning and Preparation
Data cleaning and preparation are crucial steps in the data analysis process. Before diving into statistical analysis, it is essential to ensure that the data is accurate, complete, and in the right format. This involves identifying and correcting any errors or inconsistencies in the dataset.
The first step in data cleaning is to examine the dataset for missing values. Missing data can lead to biased or incorrect results. SPSS provides various tools to handle missing values, such as imputation techniques or excluding cases with missing data from analysis.
Another aspect of data cleaning is data validation. This involves checking for outliers, which are extreme values that may affect the analysis. SPSS allows users to identify outliers through various methods, including visual inspection and statistical tests. Outliers can be corrected or removed depending on their impact on the analysis.
Furthermore, it is important to check for errors in data entry. This may involve reviewing the dataset for incorrect values, such as invalid codes or inconsistent formats. SPSS offers features for data recoding, transforming variables, and merging datasets, making it easier to correct errors and ensure data consistency.
Data transformation is another part of the data cleaning process. This includes converting variables into different formats or creating new variables based on existing ones. SPSS offers a wide range of functions and procedures for data transformation, allowing users to manipulate the dataset to better fit their analysis needs.
Once the data cleaning process is complete, it is essential to examine the quality of the dataset. This involves performing data quality checks, such as calculating data completeness, identifying duplicate records, and assessing data accuracy. SPSS provides tools for data quality assessment, enabling users to validate the integrity of their dataset.
Descriptive Statistics and Frequency Analysis
Descriptive statistics and frequency analysis are essential components of data analysis in SPSS. These techniques help to summarize and describe the characteristics and patterns within a dataset. By examining measures of central tendency, variability, and distribution, analysts can gain valuable insights into their data.
The first step in conducting descriptive statistics is to examine measures of central tendency, such as the mean, median, and mode. The mean is the average value of a variable, while the median represents the middle value. The mode, on the other hand, is the most frequently occurring value. These measures provide a quick snapshot of the dataset and give analysts an idea of the typical value within the data.
Another important aspect of descriptive statistics is understanding variability. Measures such as the range, standard deviation, and variance help to determine how spread out the data is. The range is the difference between the highest and lowest values, while the standard deviation and variance quantify the dispersion of the data around the mean. These measures allow analysts to assess the degree of variability in the dataset and identify potential outliers.
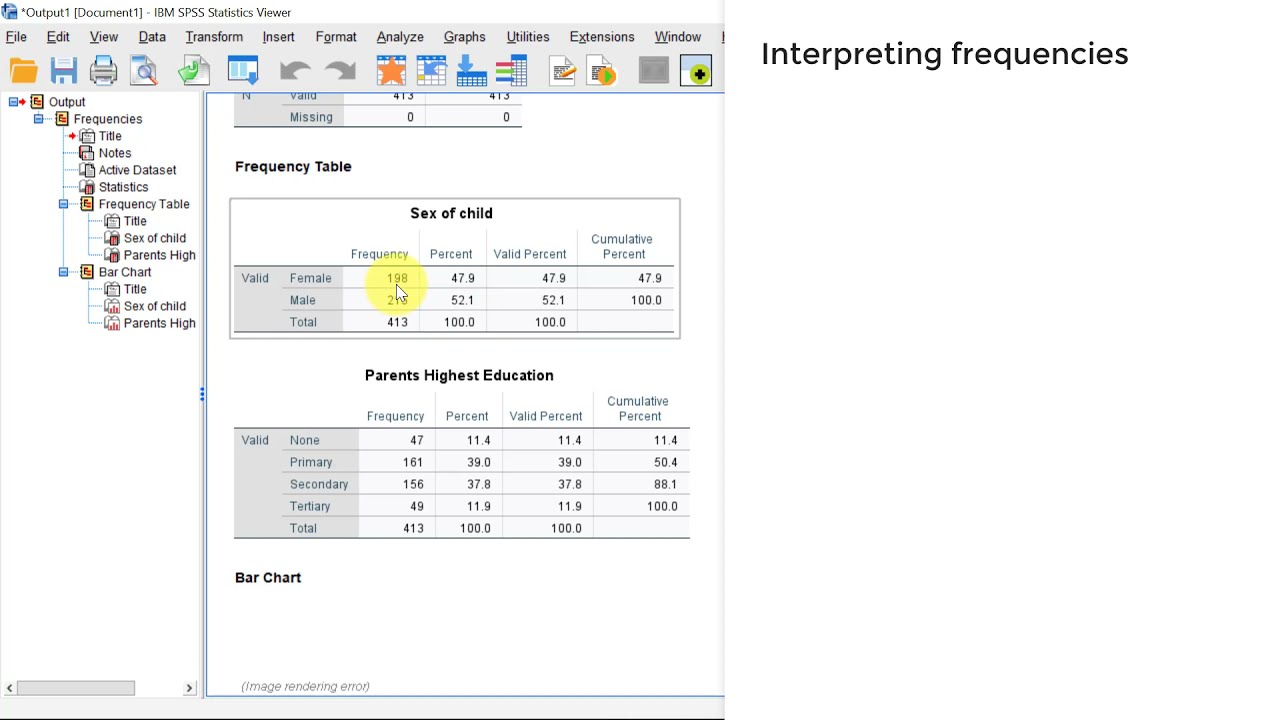
Frequency analysis, on the other hand, is used to determine the frequency or occurrence of specific values within a variable. It provides a summary of the distribution of values in a variable, which can be particularly useful in categorical variables. By examining the frequency tables and histograms, analysts can identify the most common values and detect any patterns or trends.
In SPSS, conducting descriptive statistics and frequency analysis is straightforward. Once the dataset is imported, analysts can select the variables of interest and go to the “Analyze” menu. From there, they can choose “Descriptive Statistics” and then “Frequencies” to generate the necessary output. SPSS provides a comprehensive summary of the measures of central tendency, variability, and frequency distribution.
Overall, descriptive statistics and frequency analysis play a crucial role in understanding the characteristics and patterns within a dataset. By examining measures of central tendency, variability, and frequency distribution, analysts can make informed decisions and draw meaningful insights from their data. SPSS provides a user-friendly platform to perform these analyses efficiently, making it an invaluable tool for researchers and analysts.
Explore and Analyze Relationships
In SPSS, exploring and analyzing relationships between variables is a powerful tool for understanding patterns and trends within your data. By examining how variables are related to each other, you can gain valuable insights and make informed decisions. Let’s dive into some of the key methods and techniques for exploring and analyzing relationships in SPSS.
- Correlation Analysis:
- Cross-Tabulation:
- Scatterplots:
- Regression Analysis:
- Factor Analysis:
Correlation analysis is used to determine the strength and direction of the relationship between two continuous variables. SPSS makes it easy to calculate and interpret correlation coefficients using Pearson’s correlation. This analysis can help you identify if there is a positive, negative, or no relationship between variables.
Cross-tabulation, also known as contingency table analysis, is used to explore relationships between two categorical variables. SPSS allows you to generate cross-tabulation tables, which display the frequency and percentage distribution of the variables. This analysis helps you identify any association or dependency between the variables.
Scatterplots are visual representations of the relationship between two continuous variables. SPSS enables you to create scatterplots with a simple click. By examining the scatterplot, you can identify patterns such as linear, non-linear, or no relationship between the variables. This visual analysis can provide insights into the nature of the relationship.
Regression analysis is used to examine the relationship between a dependent variable and one or more independent variables. SPSS offers various regression models, such as simple linear regression, multiple linear regression, and logistic regression. Regression analysis helps you understand how changes in the independent variables affect the dependent variable.
Factor analysis is used to identify underlying factors or dimensions within a set of observed variables. SPSS allows you to perform exploratory factor analysis, which helps you uncover the latent structure of your data. By understanding the relationships between variables, factor analysis streamlines data interpretation and simplifies complex data sets.
These methods are just a few examples of how you can explore and analyze relationships in SPSS. Depending on your specific research question or objective, you may choose different techniques to gain insights from your data. SPSS provides a comprehensive suite of tools and analyses to assist you in this process, empowering you to make data-driven decisions.
Conducting Statistical Tests
When analyzing data in SPSS, conducting statistical tests is a crucial step in understanding the relationships and patterns within your data. Whether you are trying to compare means, examine associations, or test hypotheses, SPSS provides a wide range of statistical tests to help you uncover meaningful insights. In this section, we will explore some of the commonly used statistical tests in SPSS and how to interpret their results.
1. t-Test: The t-test is used to compare means between two groups. It is commonly used to determine if there is a significant difference in the means of two variables. For example, you might use a t-test to compare the average test scores of students who received a traditional teaching method versus those who received a new teaching method.
2. Anova: ANOVA (analysis of variance) is used to compare means between three or more groups. It assesses whether the variances between the groups are significantly different. This test is useful when you want to examine the differences between multiple conditions or treatments. For instance, you might use ANOVA to analyze the effect of different types of fertilizer on crop yields.
3. Chi-squared test: The chi-square test is used to determine if there is a significant association between two categorical variables. It is often used to analyze survey data or assess the relationship between variables that are not normally distributed. For example, you might use a chi-square test to determine if there is a significant association between smoking status and lung cancer incidence.
4. Correlation: Correlation analysis is used to measure the strength and direction of the linear relationship between two continuous variables. It helps you understand how changes in one variable are related to changes in another variable. For example, you might use correlation analysis to examine the relationship between age and income.
5. Regression: Regression analysis allows you to model the relationship between a dependent variable and one or more independent variables. It helps you predict the value of the dependent variable based on the values of the independent variables. Regression analysis is widely used in fields such as economics, psychology, and social sciences.
6. Factor analysis: Factor analysis is used to explore the underlying structure of a set of observed variables. It identifies groups of variables that are related and groups them into factors. This technique is often used in market research, psychology, and sociology to uncover latent dimensions or constructs.
7. MANOVA: Multivariate analysis of variance (MANOVA) is an extension of ANOVA that allows you to analyze multiple dependent variables simultaneously. It helps you understand the relationship between several dependent variables and one or more independent variables. MANOVA is commonly used in fields like psychology and education when multiple outcomes need to be considered.
8. Non-parametric tests: SPSS also offers non-parametric tests that do not require the assumption of a particular distribution of data. These tests are useful when the data does not meet the assumptions of parametric tests. Some commonly used non-parametric tests in SPSS include the Mann-Whitney U test for comparing two independent groups and the Kruskal-Wallis test for comparing three or more independent groups.
By conducting these statistical tests in SPSS, you can uncover valuable insights and make data-driven decisions. It is important to interpret the results of these tests carefully and consider the limitations and assumptions associated with each test.
Keep in mind that choosing the right statistical test depends on the type of data you have and the research questions you are trying to answer. If you are unsure about which test to use or how to interpret the results, it is always recommended to consult with a statistician or data analyst to ensure accurate and reliable analysis.
Creating Charts and Graphs
Creating charts and graphs is an essential part of data analysis in SPSS. Visual representations of data can help us gain insights and identify patterns more efficiently. SPSS provides various options to create informative and visually appealing charts and graphs. Let’s explore some of the key features and steps involved in creating charts and graphs in SPSS.
1. Selecting the appropriate chart type: SPSS offers a wide range of chart types, including bar charts, line graphs, scatter plots, histograms, and pie charts. The choice of chart type depends on the nature of the data and the research objectives. It’s important to select a chart type that effectively represents the data and highlights the relationships or trends of interest.
2. Customizing the chart: SPSS allows users to customize various aspects of the chart, such as colors, fonts, labels, and legends. Customization helps in enhancing the visual clarity and aesthetic appeal of the chart, making it more impactful and easy to interpret.
3. Adding titles and annotations: It’s important to provide appropriate titles and annotations to the chart to give it context and clarity. Titles should accurately describe the purpose of the chart, while annotations can provide additional explanations or insights to guide the viewers.
4. Grouping and categorizing data: SPSS enables users to group and categorize data to create meaningful and informative charts. This feature comes in handy when analyzing data with multiple variables or different categories, allowing for comparisons and visual representation of complex relationships.
5. Exporting and sharing charts: Once you have created your chart or graph in SPSS, you can easily export it in various formats, such as image files or PDFs, for further use or sharing with others. This feature facilitates the integration of SPSS-generated charts into reports, presentations, or academic papers.
By utilizing the chart creation features in SPSS, you can effectively communicate your data analysis results and findings to a wider audience in a visually appealing and understandable format. Remember to choose the appropriate chart type, customize it to enhance its impact, provide clear titles and annotations, and consider grouping and categorizing options based on your research objectives. Happy charting!
Reporting and Interpreting Results
Once you have analyzed your data in SPSS, the next step is to report and interpret your findings. This process involves summarizing and presenting the results of your analysis in a clear and concise manner. Here are some key steps to help you effectively report and interpret your results:
- Provide a clear and concise summary of your research question or hypothesis.
- Present the descriptive statistics of your variables of interest. This includes measures such as means, standard deviations, and frequencies.
- Include relevant charts, graphs, or tables to visually represent your data. This can make it easier for your audience to understand the patterns and trends in your results.
- Explain any statistical tests or analyses that you conducted. Provide details on the methods, assumptions, and significance levels used.
- Interpret your findings in the context of your research question or hypothesis. Explain the implications and meaning of the results.
- Discuss any limitations or potential sources of error in your study. This demonstrates a critical understanding of your research and adds credibility to your findings.
- Compare your results with previous studies or theoretical expectations. This allows you to place your findings in a broader context and make connections to existing knowledge.
- Conclude your report by summarizing the main findings and their implications.
When reporting and interpreting your results, it is important to use clear and concise language that is accessible to your target audience. Avoid using jargon or technical terms that may confuse your readers. Instead, focus on explaining the key findings and their relevance to your research question or hypothesis.
Remember, the goal of reporting and interpreting your results is to communicate the significance of your findings and contribute to the existing body of knowledge in your field. By presenting your results in a clear and meaningful way, you can ensure that your research has a lasting impact.
Conclusion
In conclusion, analyzing data in SPSS is a valuable skill that can greatly enhance your research and data-driven decision-making processes. With its wide range of statistical tools and features, SPSS provides a comprehensive platform for exploring, visualizing, and interpreting data. By following the steps outlined in this article, you can confidently navigate the SPSS interface, import your data, perform various statistical analyses, and generate meaningful insights.
Remember, to effectively analyze data in SPSS, it is essential to have a clear research question or objective in mind, as well as a solid understanding of the statistical techniques and tests that are appropriate for your data. With practice and continued learning, you will become proficient in utilizing SPSS to uncover patterns, identify trends, and draw valid conclusions from your data.
So, whether you are a student, researcher, or professional in any field, mastering SPSS can be a valuable asset and open doors to new opportunities in data analysis and research. Start exploring the power of SPSS today and unlock the potential of your data!
FAQs
1. What is SPSS?
SPSS (Statistical Package for the Social Sciences) is a software program widely used for statistical analysis and data management. It provides a range of tools and techniques to help researchers and data analysts analyze and interpret data.
2. How does SPSS help in data analysis?
SPSS offers a user-friendly interface and a wide range of features specifically designed for data analysis. It allows you to perform various statistical tests, explore relationships between variables, create visualizations, and generate reports. SPSS also provides advanced features for data management, data cleaning, and data transformation.
3. Can I import data from different file formats into SPSS?
Yes, SPSS allows you to import data from various file formats such as Excel, CSV, and text files. You can easily import your data into SPSS and start analyzing it using the available tools and functions.
4. What statistical tests can I perform in SPSS?
SPSS provides a wide range of statistical tests to analyze data. Some commonly used tests include t-tests, chi-square tests, ANOVA, correlation analysis, regression analysis, and factor analysis. SPSS also offers advanced procedures for complex statistical analysis, including cluster analysis and survival analysis.
5. Can I customize the output and generate professional reports in SPSS?
Yes, SPSS allows you to customize the output and generate professional reports. You can choose the type of output, apply formatting options, add charts and tables, and export the results in various formats such as PDF, Word, and Excel. This feature is especially useful for creating professional reports to communicate your findings effectively.