
If you’re a Mac user looking to harness the power of data analysis, you’re in luck! Excel, the popular and versatile spreadsheet software, provides robust capabilities for analyzing and interpreting data. Whether you’re a business professional, a student, or a data enthusiast, learning how to add data analysis in Excel on Mac can greatly enhance your ability to make informed decisions.
In this article, we’ll guide you through the process of adding data analysis tools to your Excel on Mac. From installing the necessary features to performing statistical analysis and creating meaningful visualizations, you’ll gain the knowledge and skills to unlock the full potential of Excel for data analysis.
So, grab your Mac, open Excel, and get ready to dive into the exciting world of data analysis! Let’s explore how you can supercharge your spreadsheet game and take your data analysis skills on Mac to the next level.
Inside This Article
- Overview
- Step 1: Installing the Data Analysis ToolPak
- Step 2: Enabling the Data Analysis ToolPak
- Step 3: Performing Data Analysis in Excel
- Conclusion
- FAQs
Overview
Adding data analysis functionality to Microsoft Excel on a Mac can greatly enhance your ability to manipulate and interpret data. With the Data Analysis ToolPak, you can access a wide range of statistical and analytical tools that can help you make informed decisions and gain valuable insights from your data. In this article, we will walk you through the steps required to install the Data Analysis ToolPak on your Mac, enable it in Excel, and perform data analysis tasks with ease.
Whether you are a student, a business professional, or a data enthusiast, having the ability to analyze data effectively is crucial. The Data Analysis ToolPak provides you with a suite of statistical tools that can handle complex calculations, generate accurate forecasts, identify trends, and more. By enabling data analysis in Excel on your Mac, you can streamline your workflow and save time by performing these tasks directly within the familiar Excel interface.
Excel is widely regarded as a powerful tool for organizing and manipulating data, and with the Data Analysis ToolPak, its capabilities are further expanded. By bringing sophisticated statistical functions to Excel, you can unlock advanced data analysis techniques without the need for additional software or complex coding. This makes it accessible to users across various industries and backgrounds, regardless of their level of expertise in statistics or programming.
From basic descriptive statistics to more advanced analysis such as regression, sampling, and goal seek, the Data Analysis ToolPak offers a comprehensive set of features for analyzing and interpreting your data. Having these tools at your disposal can greatly improve the accuracy and efficiency of your decision-making processes, allowing you to make data-driven choices and gain a competitive edge in your field.
So, if you are ready to take your data analysis skills to the next level and tap into the full potential of Excel on your Mac, read on to learn how to install and enable the Data Analysis ToolPak, as well as how to perform various data analysis tasks with ease.
Step 1: Installing the Data Analysis ToolPak
If you want to leverage the power of data analysis in Excel on your Mac, the first step is to install the Data Analysis ToolPak. This ToolPak is a useful add-in that provides a variety of statistical analysis tools to help you make informed decisions based on data.
To install the Data Analysis ToolPak on your Mac, follow these simple steps:
-
Launch Microsoft Excel on your Mac.
-
Click on the “Tools” tab in the top menu bar.
-
From the dropdown menu, select “Add-Ins.”
-
In the Add-Ins window, check the box next to “Analysis ToolPak” and click “OK.” This will initiate the installation process.
-
You may be asked to insert your Microsoft Office installation disk or provide the path to the installation files. Follow the on-screen instructions to complete the installation.
-
Once the installation is complete, you will find the Data Analysis ToolPak option in the “Data” tab of the Excel menu bar.
It’s important to note that the Data Analysis ToolPak is not included by default in Excel for Mac. By following these installation instructions, you will add this powerful tool to your Excel software, allowing you to perform various data analysis tasks.
Step 2: Enabling the Data Analysis ToolPak
To unlock the powerful data analysis capabilities in Excel on your Mac, you need to enable the Data Analysis ToolPak. This feature allows you to access a wide range of statistical and analytical functions that can help you make informed decisions and gain valuable insights from your data.
Enabling the Data Analysis ToolPak is a simple process that involves a few easy steps. Follow the instructions below to enable this feature on your Mac:
- Open Excel on your Mac and click on the “Tools” option in the menu bar.
- Select “Excel Add-Ins” from the drop-down menu.
- In the “Add-Ins” dialog box, check the box next to “Analysis ToolPak” and click “OK”.
- A message will appear, asking if you want to install the “Analysis ToolPak”. Click “Yes” to proceed.
- Excel will then install the Data Analysis ToolPak. Once the installation is complete, you can start using the data analysis functions.
Enabling the Data Analysis ToolPak gives you access to a wide range of statistical functions such as regression analysis, hypothesis testing, sampling, and many more. It allows you to analyze large data sets and uncover meaningful patterns and trends.
Note that once the Data Analysis ToolPak is enabled, you will find a new option called “Data Analysis” in the “Data” tab of the Excel ribbon. From there, you can choose the specific analysis tool you want to use and customize it according to your needs.
By enabling the Data Analysis ToolPak in Excel on your Mac, you can harness the power of data analysis and make more informed decisions. It is a valuable feature for researchers, analysts, and anyone who deals with data on a regular basis.
Step 3: Performing Data Analysis in Excel
Once you have installed and enabled the Data Analysis ToolPak in Excel on your Mac, you are ready to dive into performing data analysis. With this powerful tool, you can gain valuable insights and make informed decisions based on the data at hand. Here are some key features and techniques to help you leverage the Data Analysis ToolPak effectively:
1. Descriptive Statistics: This feature allows you to calculate various statistical measures such as mean, median, mode, standard deviation, and more. To access this tool, navigate to the Data tab, click on Data Analysis, and select Descriptive Statistics. You can then choose the input range and the desired statistics to generate a summary report.
2. Histogram: A histogram is a graphical representation of the distribution of your data. It displays the frequencies of data points that fall within specified intervals. To create a histogram in Excel, go to the Data tab, click on Data Analysis, and select Histogram. Then, specify the input range and the bin range (intervals) to visualize the distribution of your data.
3. Regression Analysis: This tool allows you to analyze the relationship between two or more variables and predict future outcomes. With regression analysis, you can determine the strength and direction of the relationship, calculate regression coefficients, and generate a regression equation. To perform regression analysis, go to the Data tab, click on Data Analysis, and select Regression.
4. Sampling: Sampling is a technique used to estimate characteristics of a larger population based on a subset of data. Excel’s Data Analysis ToolPak provides multiple sampling methods such as simple random sampling, stratified sampling, and cluster sampling. To utilize these techniques, select the Sampling option under the Data Analysis menu.
5. ANOVA: Analysis of Variance (ANOVA) is a statistical method used to compare means of multiple groups and determine if there are significant differences between them. Excel’s Data Analysis ToolPak offers a simple way to conduct ANOVA tests. Navigate to the Data tab, click on Data Analysis, and choose ANOVA from the list.
6. Correlation: Correlation analysis helps you understand the relationship between two variables and whether they are positively or negatively correlated. In Excel, you can perform correlation analysis using the Data Analysis ToolPak. Select Correlation under the Data Analysis menu, specify the input range for the variables, and Excel will generate a correlation matrix.
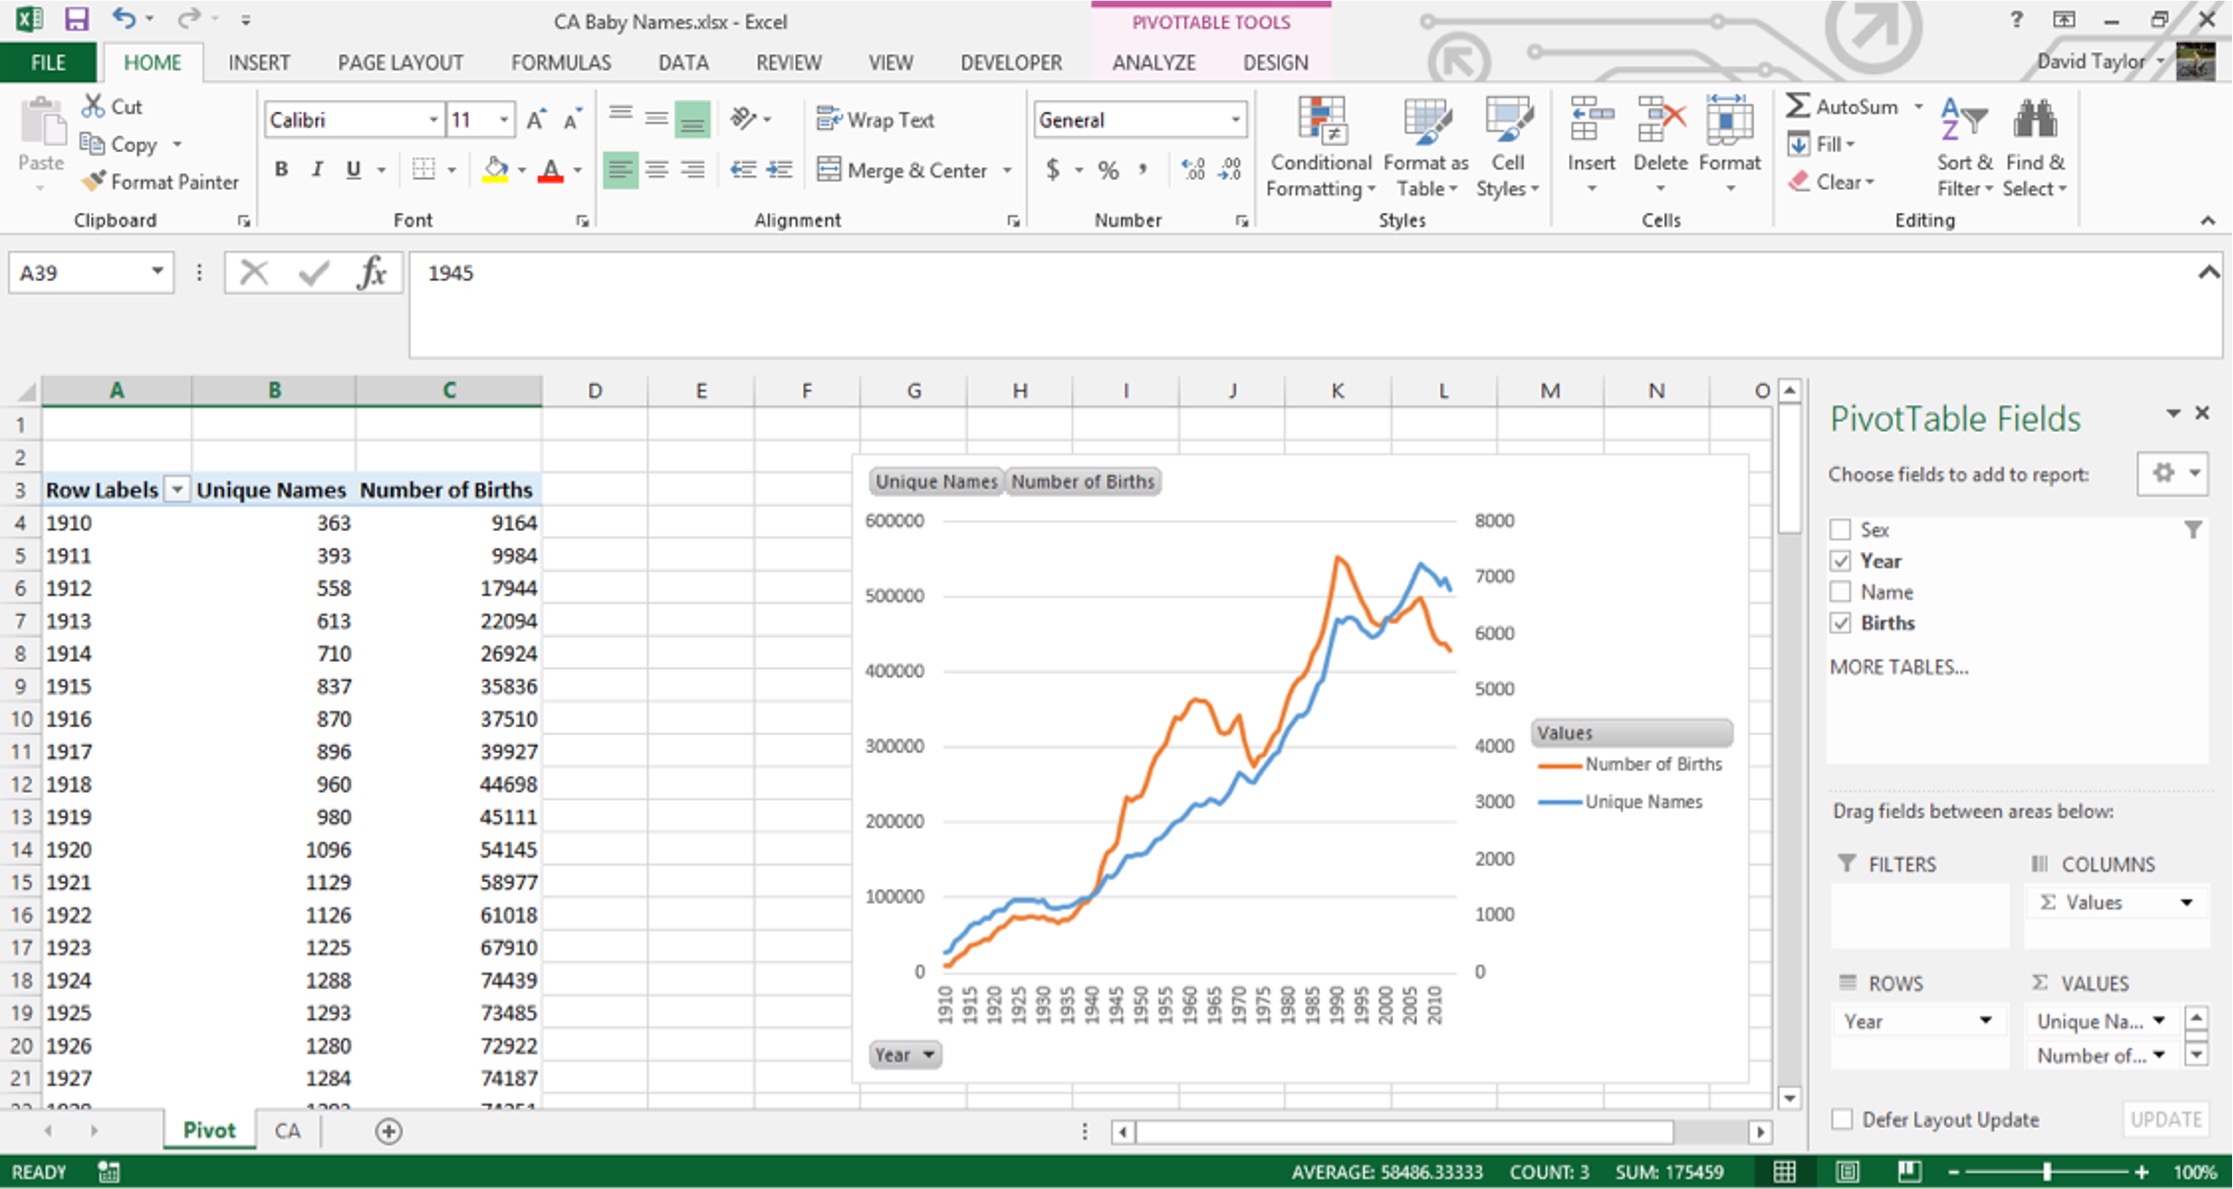
7. PivotTables: PivotTables allow you to summarize, analyze, and present large datasets in a compact and customizable format. You can quickly create PivotTables by going to the Data tab and selecting PivotTable. Then, choose the data range, drag and drop variables into rows and columns, and apply desired calculations and filters to analyze the data.
These are just a few examples of the many data analysis tools and techniques that Excel offers with the Data Analysis ToolPak. By exploring these features and experimenting with your data, you can uncover meaningful patterns, trends, and insights that can drive informed decision-making.
Conclusion
Adding data analysis in Excel on Mac can greatly enhance the functionality and usefulness of your spreadsheets. With the various data analysis tools available, you can easily make sense of complex data sets, identify trends, and derive valuable insights.
By following the steps outlined in this guide, you can effectively leverage Excel’s data analysis capabilities on your Mac. Whether you need to perform statistical analysis, create charts and graphs, or utilize advanced functions like regression analysis, Excel provides powerful tools to help you make informed decisions.
Remember to experiment with different analysis techniques and tools to find the most suitable ones for your specific needs. With practice and familiarity, you’ll become proficient in using Excel for data analysis, unlocking a whole new level of productivity and efficiency in your work.
So go ahead, unleash the power of data analysis in Excel on your Mac, and take your spreadsheet skills to the next level!
FAQs
1. Can I add data analysis in Excel on a Mac?
Absolutely! Excel on Mac provides all the necessary tools and functionalities to perform data analysis. Whether you are a beginner or an advanced user, you can use Excel on Mac to analyze data and generate insights efficiently.
2. How do I access the Data Analysis Toolpak in Excel on Mac?
To access the Data Analysis Toolpak in Excel on Mac, follow these steps:
– Open Excel on your Mac.
– Click on “Tools” in the top menu bar.
– Select “Excel Add-ins” from the dropdown menu.
– In the Add-Ins dialog box, check the box next to “Analysis Toolpak.”
– Click “OK” to enable the Toolpak.
3. What are some popular data analysis tools available in Excel on Mac?
Excel on Mac offers a wide range of powerful data analysis tools. Some popular ones include:
– PivotTables: Used for summarizing and analyzing large datasets.
– Data Tables: Allows you to perform “What-If” analysis by exploring different scenarios.
– Solver: Helps you find optimal solutions for complex problems.
– Regression Analysis: Used to analyze relationships between variables and predict future outcomes.
– Descriptive Statistics: Provides summary statistics such as mean, median, and standard deviation.
4. Can I create custom formulas for data analysis in Excel on Mac?
Yes, Excel on Mac allows you to create custom formulas using functions and operators to perform advanced data analysis. You can combine formulas, use logical operations, and manipulate data to meet your specific analysis requirements. The flexibility of Excel’s formula language gives you the power to perform complex calculations and manipulate data in various ways.
5. Are there any online resources or tutorials available for data analysis in Excel on Mac?
Yes, there are numerous online resources and tutorials available to help you learn and master data analysis in Excel on Mac. Here are a few reputable sources:
– Microsoft Office Support: The official support website of Microsoft offers a range of tutorials and guides to help you navigate Excel’s data analysis features.
– YouTube: You can find many video tutorials created by Excel experts that demonstrate various data analysis techniques in Excel on Mac.
– Online Learning Platforms: Websites like Udemy, Coursera, and LinkedIn Learning offer interactive courses on data analysis in Excel on Mac, taught by industry professionals.