
In the world of digital marketing, connecting and analyzing data from different platforms is crucial for making informed business decisions. One such integration that can greatly benefit marketers is connecting Facebook Ads to Google Data Studio.
By connecting these two powerful tools, marketers can gain deeper insights into their Facebook ad campaigns and visualize the data in a comprehensive and visually appealing way. This integration allows for a seamless flow of data between Facebook Ads and Google Data Studio, enabling marketers to create customizable reports and dashboards for better analysis and reporting.
In this article, we will guide you through the process of connecting Facebook Ads to Google Data Studio, providing you with step-by-step instructions and highlighting the benefits of this integration. So, let’s dive in and unlock the full potential of your Facebook ad campaign data with Google Data Studio!
Inside This Article
- Overview of Facebook Ads and Google Data Studio
- Connecting Facebook Ads to Google Data Studio
- Creating Data Sources in Google Data Studio
- Building Custom Reports and Dashboards
- Conclusion
- FAQs
Overview of Facebook Ads and Google Data Studio
In today’s digital age, advertising on social media platforms has become an integral part of any successful marketing strategy. Facebook Ads is one of the most popular advertising platforms, allowing businesses to reach a vast audience with highly targeted campaigns. On the other hand, Google Data Studio is a powerful tool that helps visualize and analyze data from various sources.
Facebook Ads allows businesses to create and manage ad campaigns on the Facebook, Instagram, and Audience Network platforms. With its advanced targeting options, businesses can tailor their ads to specific demographics, interests, locations, and behaviors. Facebook Ads provides valuable insights on ad performance, audience engagement, and conversion tracking, enabling businesses to optimize their marketing efforts.
On the other hand, Google Data Studio is a free, cloud-based data visualization tool. It allows businesses to connect various data sources and create interactive reports and dashboards. With its intuitive drag-and-drop interface, businesses can easily customize visualizations, integrate data from multiple platforms, and share reports in real-time.
By connecting Facebook Ads data to Google Data Studio, businesses can get a holistic view of their advertising performance. They can analyze and combine data from different platforms, track key metrics, and identify trends and patterns. This enables businesses to make data-driven decisions and optimize their marketing strategies for better results.
Connecting Facebook Ads to Google Data Studio provides numerous benefits. It eliminates the need for manual data extraction and consolidation, saving businesses time and resources. It also allows businesses to create comprehensive reports that include data from multiple sources, providing a more accurate and holistic view of their marketing efforts.
Connecting Facebook Ads to Google Data Studio
Facebook Ads and Google Data Studio are powerful tools that allow businesses to analyze and visualize their advertising data. By connecting Facebook Ads to Google Data Studio, marketers gain deeper insights and can create custom reports and dashboards to track the performance of their ad campaigns. In this article, we will walk you through the steps to connect Facebook Ads to Google Data Studio.
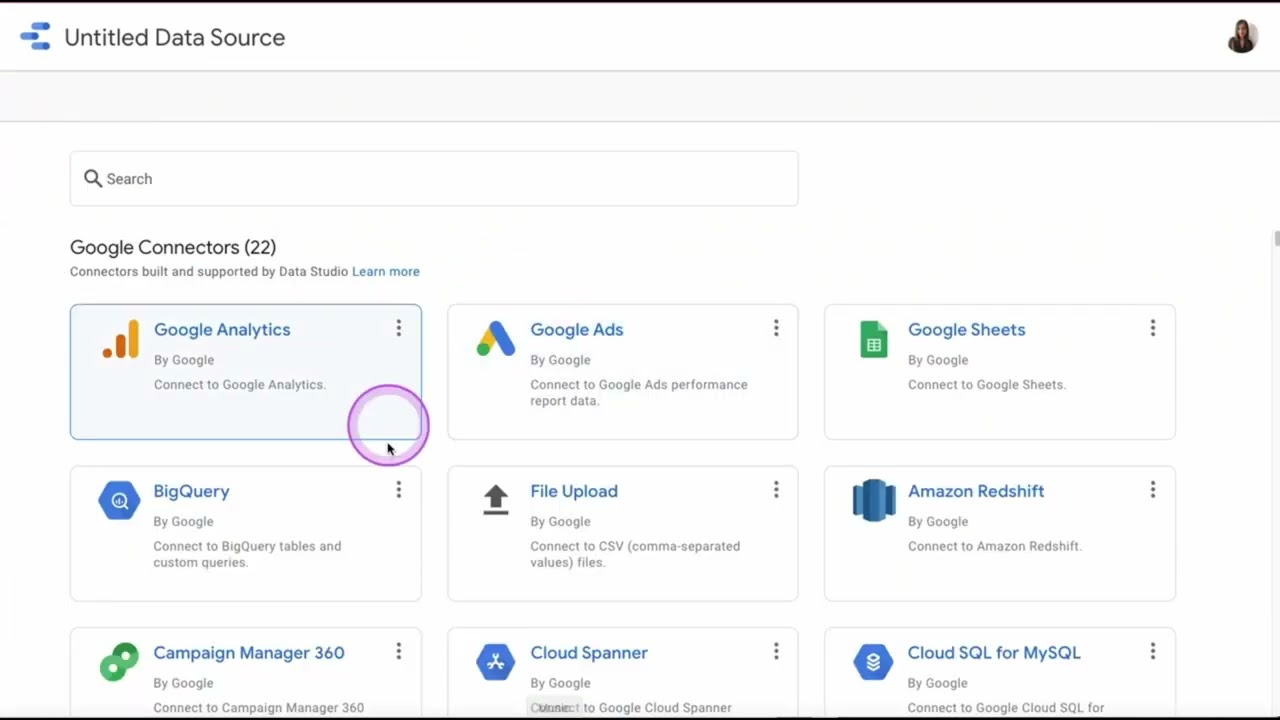
The first step is to open Google Data Studio and create a new report. Once you have your report set up, click on the “Data Sources” tab in the left-hand sidebar. Here, you will find a list of available data sources that you can connect to your report.
To connect Facebook Ads to Google Data Studio, click on the “Create New Data Source” button. A new window will appear, showing a list of available connectors. Scroll down and select “Facebook Ads” from the list.
Next, you will be prompted to authenticate your Facebook account. This ensures that you have the necessary permissions to access your Facebook Ads data. Click on the “Authenticate” button and follow the on-screen instructions to grant access.
Once you have successfully authenticated your Facebook account, you can customize the data source settings. You can choose the Facebook Ads account to connect, select the date range, and even apply filters to the data. These settings allow you to retrieve the specific ad data you want to analyze.
After configuring the data source settings, click on the “Connect” button to establish the connection between Facebook Ads and Google Data Studio. The data source will then be created and added to your report.
Now that you have connected Facebook Ads to Google Data Studio, you can start building custom reports and dashboards. Google Data Studio provides a wide range of visualization options, including charts, tables, and graphs, allowing you to present your ad campaign data in a visually appealing way.
To create a new report, simply click on the “Create Report” button in the main Data Studio dashboard. From there, you can drag and drop the desired data fields onto the canvas to create visualizations. You can also customize the appearance, layout, and style of your report to align with your branding and reporting needs.
Furthermore, Google Data Studio allows you to add multiple data sources to a single report, enabling you to combine data from different platforms, such as Facebook Ads and Google Analytics. This holistic approach to data analysis provides a comprehensive view of your marketing efforts and helps you make data-driven decisions.
Creating Data Sources in Google Data Studio
In order to connect your Facebook Ads data to Google Data Studio, you need to create a data source within Google Data Studio. A data source is a connection to an external data set that allows you to retrieve and analyze the data in your reports and dashboards.
To create a data source in Google Data Studio, follow these steps:
- Log in to your Google Data Studio account and navigate to the homepage.
- Click on the “Create” button to start creating a new report or dashboard.
- On the left-hand side, you’ll find a menu with various options. Click on “Data” to access the data source creation interface.
- In the data source creation interface, you will be prompted to choose a connector. A connector is a service or platform that allows you to import and visualize your data. Since we want to connect Facebook Ads, search for the Facebook Ads connector.
- Click on the Facebook Ads connector to select it. You may need to log in to your Facebook Ads account and authorize the connector to access your data.
- Once the connector is selected, you will be presented with a list of available data sets. Choose the data set that contains the data you want to import into Google Data Studio.
- Next, you will need to configure the data source by selecting the specific dimensions and metrics you want to include in your reports and dashboards.
- Once you have configured the data source, click on the “Connect” button to establish the connection between your Facebook Ads account and Google Data Studio.
- Google Data Studio will then retrieve and import the data from your Facebook Ads account into the data source.
- Finally, you can give your data source a name and save it for future use.
Once you have created a data source in Google Data Studio, you can now use it to build custom reports and dashboards that visualize your Facebook Ads data in a way that is more meaningful and insightful.
Building Custom Reports and Dashboards
Once you have connected your Facebook Ads account to Google Data Studio and created data sources, you can start building custom reports and dashboards that provide you with valuable insights into your advertising performance.
The first step is to define your goals and metrics. What do you want to track and measure? Are you interested in monitoring campaign performance, conversion rates, or audience engagement? Identify the key metrics that align with your objectives and focus on those.
Next, you can begin designing your report. Google Data Studio offers a wide range of visualization options, including charts, tables, and graphs. Drag and drop the desired components onto your canvas and arrange them in a way that makes sense for your data.
When designing your report, consider the overall structure and organization. Use grouping and sorting functionalities to categorize your data and make it easier to analyze. You can group data by campaign, date, ad set, or any other relevant dimension.
Additionally, take advantage of calculated fields in Google Data Studio to create custom metrics or perform mathematical calculations. This allows you to derive insights beyond the standard metrics available.
After building your report, you can add interactive elements to enhance user experience. Use filters to allow viewers to explore specific data segments or timeframes. Implement drill-down functionalities to enable users to dig deeper into the data and uncover more detailed information.
Once your report is complete, you can save and share it with others. Google Data Studio allows you to collaborate with team members by granting them view or edit access. You can also schedule automated email reports to be sent to stakeholders on a regular basis.
In addition to reports, you can create dynamic dashboards that provide a real-time overview of your Facebook Ads performance. Dashboards enable you to monitor multiple metrics at once and quickly identify trends or anomalies.
With Google Data Studio, you have the flexibility to customize your dashboard layout and choose from a variety of widgets. Widgets can display data in the form of charts, scorecards, or tables, creating a visually appealing and easy-to-understand dashboard.
Remember to regularly review and update your custom reports and dashboards as your advertising strategy evolves. This will ensure that you are always capturing and analyzing the most relevant data to drive informed decision-making.
Building custom reports and dashboards in Google Data Studio empowers you to extract actionable insights from your Facebook Ads data. By visualizing and analyzing your performance metrics, you can optimize your advertising strategy and achieve your marketing goals more effectively.
Conclusion
Connecting Facebook Ads to Google Data Studio is a powerful way to gain valuable insights and see a comprehensive view of your advertising performance. By integrating these two platforms, you can analyze your Facebook campaigns alongside other marketing data in Google Data Studio’s visually appealing and customizable dashboards. This seamless connection allows you to make data-driven decisions, optimize your advertising strategies, and track your overall marketing ROI more effectively.
Remember to follow the step-by-step process outlined in this article to connect Facebook Ads to Google Data Studio successfully. By taking advantage of this integration, you can unlock the full potential of your ad campaigns and achieve your marketing objectives more efficiently.
So, go ahead and connect Facebook Ads to Google Data Studio today and unlock a world of insights and analytics to boost your advertising success.
FAQs
1. Can I connect Facebook Ads to Google Data Studio?
Yes, you can. Connecting Facebook Ads to Google Data Studio allows you to gather valuable insights and visualize your Facebook advertising data in a comprehensive and interactive dashboard.
2. Why should I connect Facebook Ads to Google Data Studio?
By connecting Facebook Ads to Google Data Studio, you can easily analyze and monitor the performance of your Facebook ad campaigns. This integration allows you to create visually appealing reports and gain a deeper understanding of your ad metrics, which can ultimately help you make data-driven decisions to optimize your advertising strategy.
3. How do I connect Facebook Ads to Google Data Studio?
To connect Facebook Ads to Google Data Studio, you will need to use a connector like Supermetrics or Blendo. These connectors enable you to pull data from your Facebook Ads account and visualize it within Google Data Studio. You will need to have both a Facebook Ads account and a Google Data Studio account to complete the integration.
4. Are there any limitations or requirements for connecting Facebook Ads to Google Data Studio?
Yes, there are some limitations and requirements to consider. First, you will need to have a compatible connector that supports the integration of Facebook Ads with Google Data Studio. Additionally, you will need to have the necessary permissions and access to both your Facebook Ads account and your Google Data Studio account. Some connectors may have limitations on the amount of data you can pull and the frequency of data refresh.
5. What are the benefits of visualizing Facebook Ads data in Google Data Studio?
Visualizing your Facebook Ads data in Google Data Studio provides several benefits. Firstly, it allows for a more efficient and organized way of analyzing your ad performance by presenting the data in visually appealing and interactive dashboards. Secondly, Google Data Studio offers a wide range of visualization options, such as charts, graphs, and tables, which can help you dive deeper into your ad metrics and uncover trends and patterns. Lastly, the ability to combine your Facebook Ads data with data from other sources in Google Data Studio enables you to gain a holistic view of your marketing efforts and make more informed decisions.