
If you want to analyze the impact of changing a single variable in Excel, a one-variable data table is a powerful tool that can help you. Whether you’re a student working on a project, a business analyst analyzing different scenarios, or simply someone looking to gain insights from your data, knowing how to create a one-variable data table can save you time and enhance your decision-making process.
In this article, we will explore the step-by-step process of creating a one-variable data table in Excel. We will cover everything from setting up your data, defining the input values, configuring the data table, and interpreting the results. By the end of this article, you will have the knowledge and skills to leverage this feature in Excel to analyze various scenarios, compare different outcomes, and easily identify the best course of action.
Inside This Article
- What is a One Variable Data Table in Excel?
- Step 1: Set up the Input Values and Formula
- Step 2: Define the Data Table Range
- Step 3: Use the Data Table Function to Display Results
- Conclusion
- FAQs
What is a One Variable Data Table in Excel?
A one variable data table is a powerful tool in Microsoft Excel that allows you to explore different input values and analyze the impact on your spreadsheet calculations. It is particularly useful when you have a formula that depends on one variable and you want to see how changing that variable affects the outcome of your calculations. Instead of manually changing the input value multiple times, a one variable data table automates this process and provides a comprehensive view of the results.
With a one variable data table, you can evaluate different scenarios, perform sensitivity analysis, and make informed decisions based on the varying input values. This feature is especially handy for financial forecasting, analyzing sales projections, optimizing models, and conducting “what-if” analyses.
By leveraging a one variable data table in Excel, you can save time and effort, and gain a deeper understanding of how changes in a single variable can impact the overall results of your spreadsheet calculations.
Step 1: Set up the Input Values and Formula
Creating a one variable data table in Excel involves understanding the concept of input values and formulas. In this step, we will set up the necessary input values and create the formula that we want to analyze using the data table.
First, let’s identify the input values that we want to test and see the impact on our formula. These values can be any variables, such as interest rates, sales quantities, or production volumes. It is essential to have a clear idea of what variables you want to analyze before proceeding.
Next, we need to create a cell or range where we will input these values. For example, you might have a cell named “Interest Rate” with a pre-determined list of values, such as 3%, 5%, and 7%. You can use drop-down menus or simply type in the values directly.
Once you have set up the input values, we can move on to creating the formula. The formula should be designed to calculate the desired result based on the input values. For instance, if you are analyzing the impact of different interest rates on loan payments, your formula might be something like “=PMT(A2/12,5,-10000)” where A2 refers to the cell containing the interest rate.
Remember to use appropriate mathematical operators and functions in your formula to ensure accurate calculations. You can refer to Excel’s built-in functions or create your own custom formulas using basic arithmetic operators like +, -, *, /, as well as functions like SUM, AVERAGE, MAX, MIN, and more.
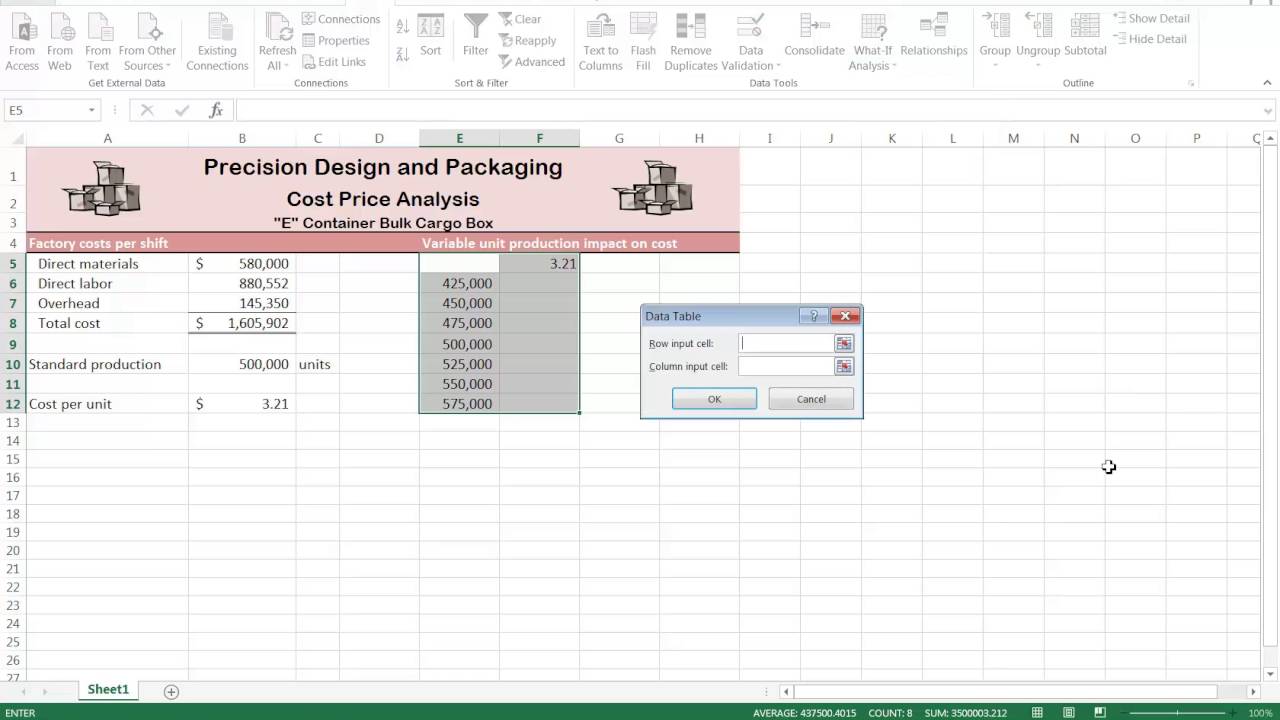
Step 2: Define the Data Table Range
Once you have set up the input values and formula in your Excel worksheet, the next step is to define the data table range. This range will determine which cells Excel will use to display the results of the data table.
To define the data table range, you need to select a range of cells where you want the results to be displayed. Typically, this range is located adjacent to the input values and formula. The size of the data table range will depend on the number of possible input values and the number of different scenarios you want to analyze.
Here’s how you can define the data table range:
- Select the range of cells where you want the data table results to be displayed. This range should include both the input values and the formula cell.
- Go to the “Formulas” tab in the Excel ribbon, and click on the “What-If Analysis” button.
- From the dropdown menu, select “Data Table.”
- A dialog box will appear, prompting you to enter the “Row input cell” and “Column input cell”. Leave these fields blank if you are only analyzing one variable.
- Click on the cell that contains the input value for the variable you are analyzing. This will populate the “Column input cell” field automatically.
- Click on “OK” to apply the data table to the selected range.
By defining the data table range, Excel will calculate the formula for each possible input value and display the results in the selected range. This allows you to quickly analyze and compare different scenarios without manually changing the input values one by one.
“
Step 3: Use the Data Table Function to Display Results
Now that you have set up the input values and defined the data table range, it’s time to unleash the power of the Data Table function in Excel. This function allows you to seamlessly display multiple results based on different input values, giving you a comprehensive view of how changing variables impact your formula.
To use the Data Table function, follow these simple steps:
- Select the cell where you want the results to be displayed. This cell should be adjacent to the formula you want to evaluate with multiple inputs.
- Go to the ‘Data’ tab in the Excel ribbon and click on ‘What-If Analysis’ in the ‘Data Tools’ group.
- Select ‘Data Table’ from the drop-down menu.
- In the ‘Data Table’ dialog box, specify the cell reference for the ‘Row Input Cell.’ This is the cell that contains the variable value you want to change along the rows of the table.
- If your formula depends on another variable that you want to change along the columns of the table, specify the cell reference for the ‘Column Input Cell.’ Otherwise, leave it blank.
- Click ‘OK’ to apply the Data Table function and display the results instantly.
Excel will automatically populate the selected cell with a table that shows the results for each combination of the input values specified in the data table range. The column input values will be displayed along the top row, while the row input values will be shown along the first column.
It’s important to note that if your formula contains complex calculations or references to other cells, the Data Table function will automatically update the values based on the input combinations. This makes it incredibly convenient to analyze different scenarios quickly and efficiently.
Furthermore, you can customize the formatting and layout of the data table to suit your needs. Excel offers a range of options to make the results visually appealing and easy to interpret.
By utilizing the Data Table function in Excel, you can gain valuable insights into how changing variables affect the outcome of your formulas. Whether you’re conducting financial analysis, performing simulations, or simply exploring “what-if” scenarios, this powerful feature will save you time and effort, allowing you to make data-driven decisions with confidence.
”
Conclusion
In conclusion, learning how to create a one variable data table in Excel can greatly enhance your data analysis capabilities. This powerful tool allows you to input different values for a single variable and quickly observe the impact on a specific output or result. By automating this process, you can save time and effort when conducting “what-if” scenarios or analyzing data with multiple variables.
Whether you need to analyze sales projections, evaluate financial scenarios, or compare different variables in a data set, a one variable data table can provide valuable insights. With the step-by-step instructions outlined in this article, you can confidently create and utilize data tables in Excel to make informed decisions and drive your business forward.
So, why wait? Start utilizing the power of one variable data tables in Excel today and unlock new possibilities for data analysis and decision-making.
FAQs
1. What is a one variable data table in Excel?
A one variable data table in Excel allows you to perform calculations and view the results based on different input variables. It is a useful tool for analyzing how changing one variable affects the outcome of a formula or function in Excel.
2. How do I create a one variable data table in Excel?
To create a one variable data table in Excel, follow these steps:
1. Enter the input values in a column or row.
2. In a separate cell, enter the formula or function that you want to analyze.
3. Click on the Data tab in the Excel toolbar.
4. Select the “What-If Analysis” option, and then click on “Data Table”.
5. In the Row Input Cell or Column Input Cell box, enter the cell reference of the input values range.
6. Click OK to create the data table.
You will now see the calculated results for each input value in the data table.
3. Can I use a two-variable data table instead of a one variable data table?
Yes, if you want to analyze the impact of changing two input variables on the outcome of a formula or function, you can use a two-variable data table in Excel. This type of data table allows you to enter multiple values for each variable and see how the combination of these values affects the result. However, it is important to note that a two-variable data table can become complex and may not be suitable for all scenarios.
4. What types of formulas or functions can I use in a one variable data table?
You can use any formula or function in a one variable data table that is supported in Excel. This includes simple mathematical calculations, statistical functions, logical functions, text functions, and more. The data table will automatically recalculate the results based on the input values and the formula or function you have specified.
5. Can I format the results in a one variable data table?
Yes, you can format the results in a one variable data table to make them more visually appealing and easier to analyze. You can apply number formatting, customize cell borders, apply conditional formatting, and use other formatting options available in Excel. Formatting the data table can help you highlight specific results or make it easier to compare different values in the table.