
If you’re looking to analyze data in Excel and explore the impact of different variables on your results, a two-variable data table can be an invaluable tool. Excel’s two-variable data table allows you to input different values for two variables and see how they interact to affect the final outcome. This can be particularly useful when trying to forecast sales, evaluate different marketing strategies, or assess the financial viability of a project.
In this article, we will guide you through the process of creating a two-variable data table in Excel. We will provide step-by-step instructions, along with useful tips and tricks to make the most out of this powerful feature. By the end of this article, you will be able to confidently utilize two-variable data tables in Excel to gain insights and make informed decisions based on your data.
Inside This Article
- Title: How To Create Two Variable Data Table In Excel
- # 1. What is a Two Variable Data Table?
- Preparing the Data
- Creating a Two Variable Data Table in Excel
- Interpreting the Results of the Data Table
- #
- Conclusion
- FAQs
Title: How To Create Two Variable Data Table In Excel
If you need to analyze and compare different combinations of data in Excel, a Two Variable Data Table can be a powerful tool. This feature allows you to input multiple variables and see the resulting calculations in a structured table format. Whether you are a data analyst, a business professional, or a student, understanding how to create a Two Variable Data Table in Excel can greatly enhance your data analysis capabilities.
To get started, you’ll need to have your data prepared in a worksheet. This data should include the different values or scenarios you want to evaluate for each variable. Make sure your data is organized in columns and rows, with appropriate headers for easy referencing. Once your source data is ready, you can proceed to create the Two Variable Data Table.
Creating a Two Variable Data Table in Excel is a straightforward process. Follow these steps to set it up:
- Select a range of cells where you want your Two Variable Data Table to appear. The first column of the table should contain the values of one variable, and the top row should contain the values of the other variable.
- In the first cell of your data table, enter the formula or function that you want to use for your calculations. This formula should reference the variables using cell references.
- Next, select the entire range of your data table, including the formula cell.
- Go to the “Data” tab in the Excel ribbon and click on “What-If Analysis” in the “Data Tools” group.
- From the dropdown menu, click on “Data Table”.
- In the “Row Input Cell” box, select the cell that represents the variable whose values will be changing vertically in the table.
- In the “Column Input Cell” box, select the cell that represents the variable whose values will be changing horizontally in the table.
- Click “OK”, and Excel will automatically populate the data table with the calculated results for each combination of variables.
Once you have created your Two Variable Data Table, you can interpret the results to gain insights and make data-driven decisions. The table will show you how each combination of variables affects the calculated value based on your formula or function. By visually analyzing the table, you can identify trends, patterns, and optimal values for your variables.
# 1. What is a Two Variable Data Table?
A two variable data table is a powerful tool in Microsoft Excel that allows you to explore different combinations of two variables and observe the impact on a single output. It is a useful feature when analyzing scenarios and making data-driven decisions.
With a two variable data table, you can input various values for two different variables, such as sales volume and product pricing, and instantly see how these values affect the final result, such as total revenue. This allows you to analyze multiple possible outcomes and identify the optimal combination of variables to achieve your desired outcome.
For example, let’s say you are a business owner and want to determine the best pricing strategy for a new product. By using a two variable data table, you can input different pricing levels and corresponding sales volumes to see how each combination impacts your overall revenue. This information can help you make informed decisions and maximize your profitability.
Preparing the Data
Before creating a two variable data table in Excel, it is important to properly prepare the data. This involves organizing the data in a structured format that Excel can easily analyze.
Here are some key steps to follow in order to prepare the data for a two variable data table:
- Identify the variables: Determine the two variables that you want to analyze in the data table. For example, if you are looking at the impact of different interest rates and loan durations on monthly loan payments, the variables would be interest rate and loan duration.
- Create a data set: Collect the necessary data related to the two variables. This could include interest rates, loan durations, and corresponding monthly loan payments. Make sure the data is accurate and comprehensive.
- Organize the data: Create a table in Excel with the variables as column headers and the corresponding data in rows. Include all the necessary data points for each variable combination. Ensure that the data is structured uniformly and free from any inconsistencies.
- Label the data: Assign clear and descriptive labels to the variables and data points. This will make it easier to interpret the results of the data table.
Once the data is properly prepared, you are ready to create the two variable data table in Excel. This will allow you to analyze the relationship between the variables and gain valuable insights.
Creating a Two Variable Data Table in Excel
Now that you have your data ready, it’s time to create a two variable data table in Excel. Here are the step-by-step instructions:
1. Open Microsoft Excel and navigate to the worksheet where you want to create the data table.
2. Arrange your data in a table format, with the variables you want to test as row and column headings. Make sure that the input values for each variable are entered in the corresponding cells.
3. Select a range of cells where you want the data table to be generated. This range should include the cells where the input values are located.
4. In Excel’s menu bar, go to the “Data” tab and click on the “What-If Analysis” option. From the drop-down menu, select “Data Table”.
5. In the “Data Table” dialog box, you will see two input fields: “Column input cell” and “Row input cell”. Enter the cell references of the variables you want to vary in these fields. For example, if your variables are in column C and row 2, you would enter $C$2 for the “Column input cell” and $B$3 for the “Row input cell”.
6. Click “OK” to create the data table. Excel will populate the selected range with the corresponding output values for each combination of the input variables.
7. Format the data table as needed, applying any desired formatting options such as bolding headers, adding borders, or changing font styles.
8. Analyze the results of the data table. Look for patterns, trends, or specific values of interest. You can use Excel’s functions and formulas to perform calculations or further analyze the data.
9. Remember to save your Excel workbook to keep your data table and analysis for future reference.
By following these steps, you can easily create a two variable data table in Excel and analyze the results. This powerful tool allows you to quickly explore the impact of different variable combinations on your data.
Interpreting the Results of the Data Table
Once you have created a two variable data table in Excel, it’s time to interpret the results. The data table provides a visual representation of how changing two input variables can affect the output. Here are some key points to consider when interpreting the results:
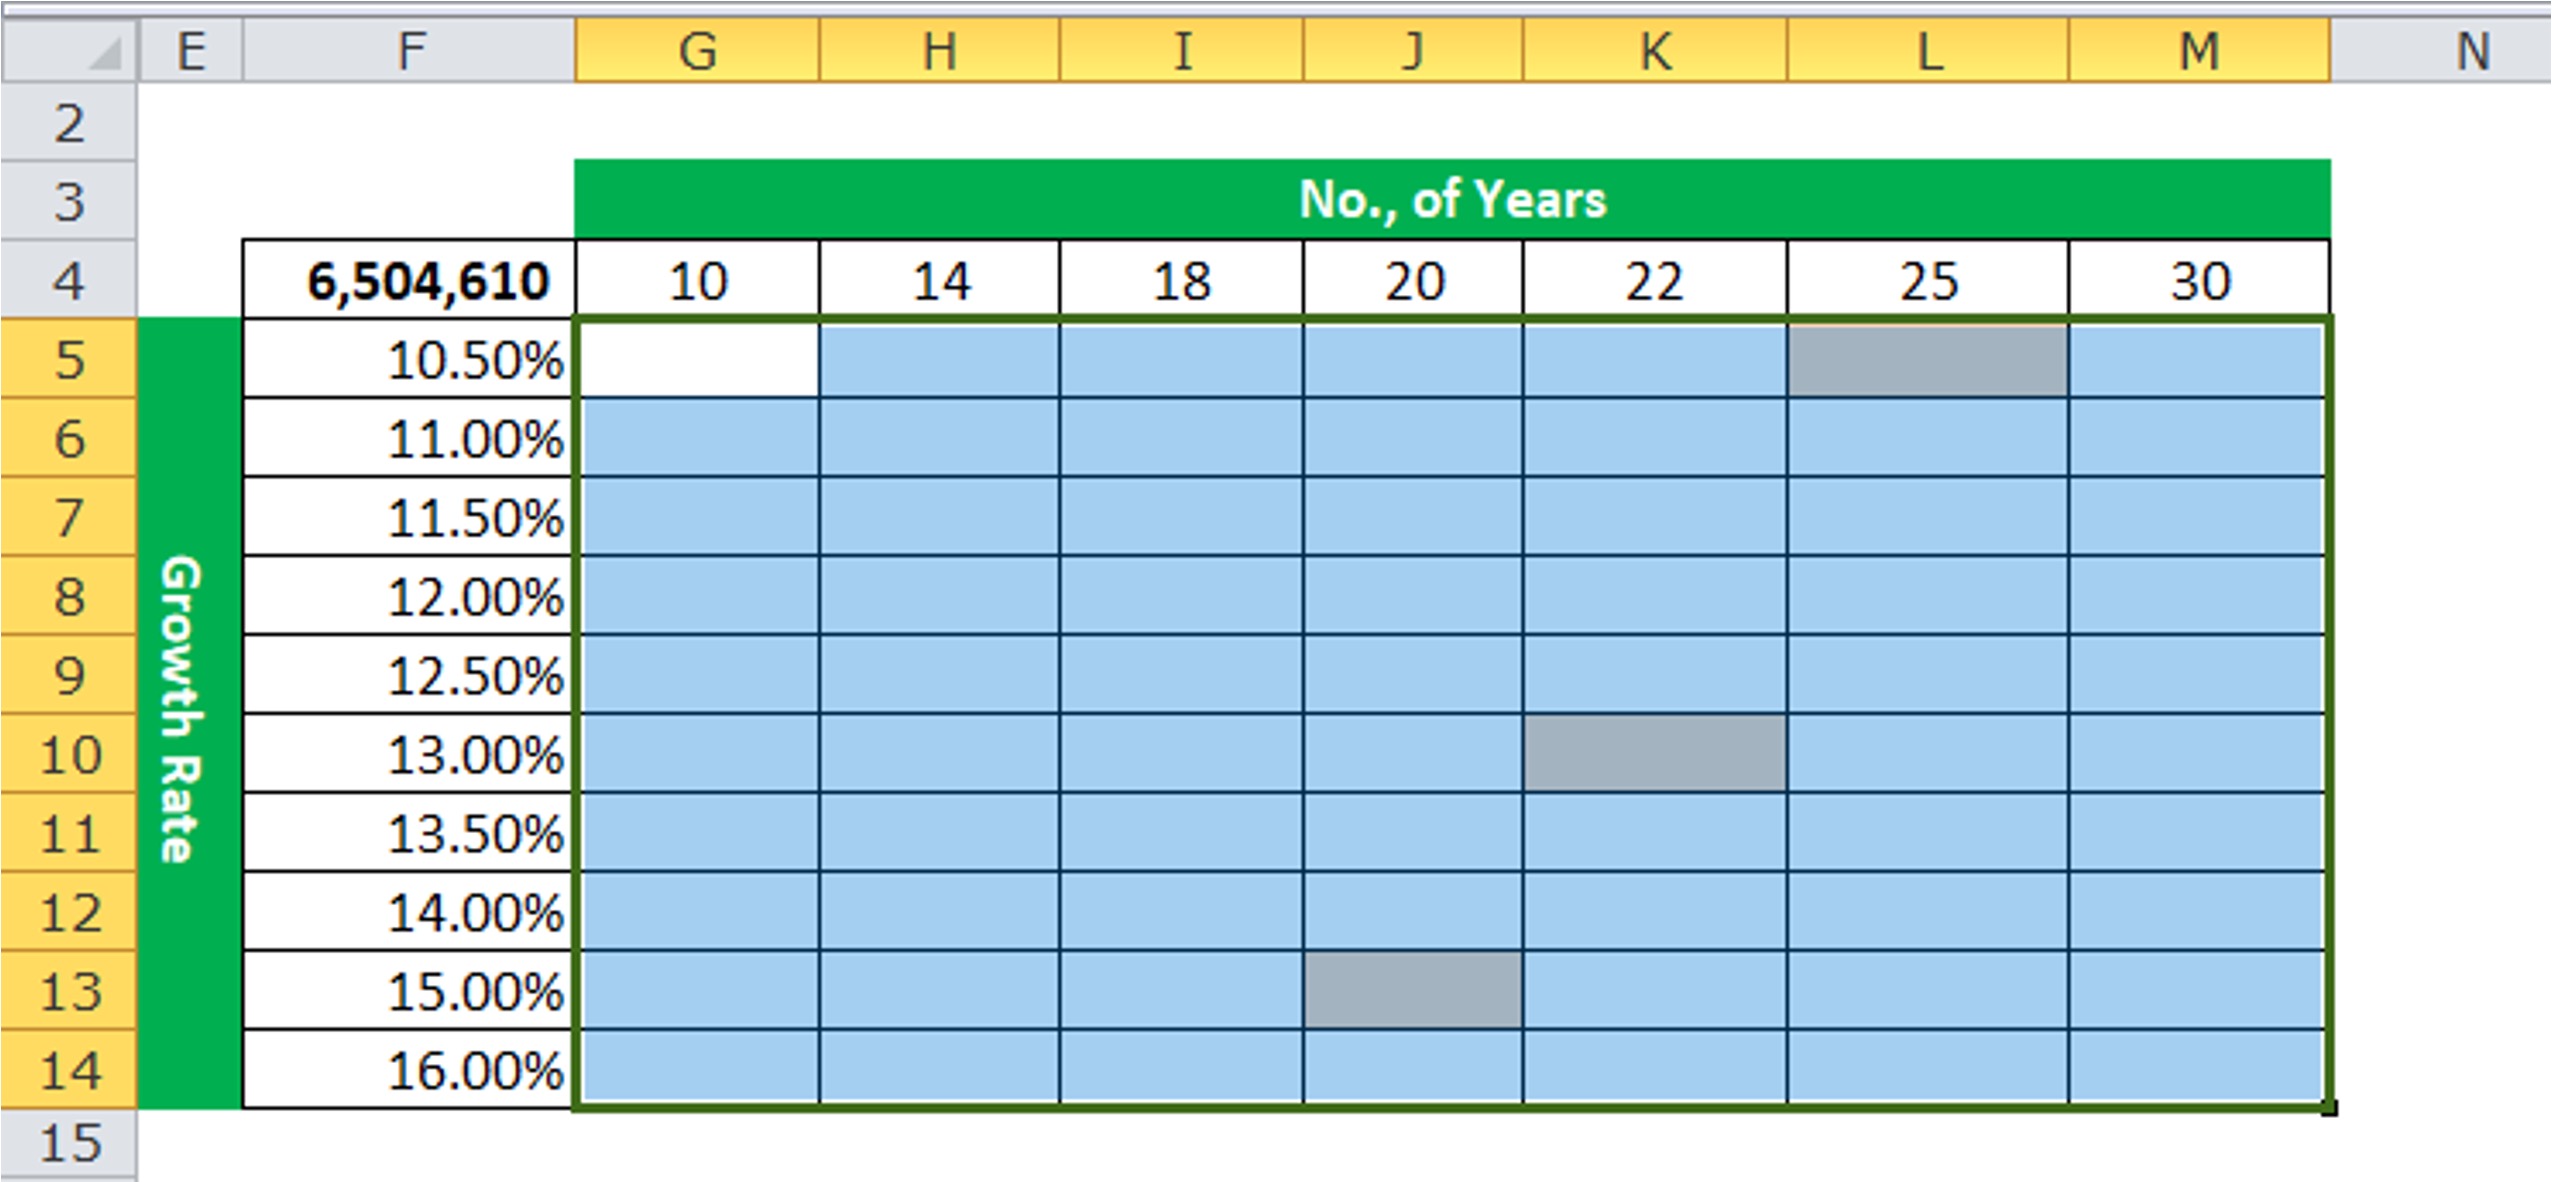
1. Understand the Structure: The data table is organized in a grid format, with the input variables listed on the left and top, and the corresponding output values displayed in the table cells. Take a moment to familiarize yourself with the layout to better analyze the results.
2. Examine the Input Variables: Identify the range of values used for each input variable. This will help you understand how different combinations of the variables were tested. Pay attention to any patterns or trends that emerge as you analyze the table.
3. Analyze the Output Values: Look at the calculated output values in the data table. Note any significant changes or variations as the input variables are adjusted. This will give you insights into how the output is affected by different combinations of the variables.
4. Identify Maxima and Minima: Identify the maximum and minimum values in the data table. These values represent the highest and lowest outputs achieved within the specified range of input variables. Understanding these extremes can help you optimize your variables for desired outcomes.
5. Identify Optimal Combinations: Look for the combinations of input variables that produce the desired output values. You can do this by scanning the data table for specific values, or by using Excel’s filtering or sorting features to quickly identify the optimal combinations.
6. Consider Sensitivity Analysis: Utilizing a two variable data table is an effective way to perform sensitivity analysis. By adjusting the input variables and observing the corresponding changes in the output, you can gain insights into the sensitivity and relationships between different variables.
7. Document and Share Findings: It’s important to document your findings and observations from the data table analysis. This will help you track your progress and ensure that the insights gained are recorded for future reference or sharing with colleagues or stakeholders.
By carefully interpreting the results from a two variable data table in Excel, you can gain valuable insights into how changing input variables can influence the output. This information can be used to make informed decisions, optimize processes, and improve overall performance in various fields such as finance, marketing, and engineering.
#
A hashtag, also known as the pound sign (#), is a symbol commonly used on social media platforms to categorize posts and make them more discoverable. Hashtags allow users to associate their content with a specific topic or theme, enabling others to find and engage with it easily. They play a crucial role in organizing and indexing content, facilitating discussions, and increasing the reach of posts.
When used strategically, hashtags can significantly impact the visibility and engagement of your social media posts. By including relevant hashtags in your captions or comments, you can broaden your content’s reach beyond your immediate network and connect with a larger audience who are interested in the same topic.
Hashtags gained popularity on Twitter and have since been adopted by other social media platforms like Instagram and Facebook. They have become an integral part of social media culture, with users creating and following hashtags related to their interests, causes, events, trends, and more.
Some popular types of hashtags include:
- Branded hashtags: These are specific to a brand or business and are used to promote campaigns, contests, or products.
- Trending hashtags: These are tags that have gained popularity and are currently being widely used by users.
- Event hashtags: These are hashtags created for a specific event or occasion, allowing participants to share and follow related content.
- Industry-specific hashtags: These hashtags are associated with a particular industry or niche and are used to connect with like-minded individuals or showcase expertise.
When using hashtags, it’s essential to choose them wisely. Here are some tips to keep in mind:
- Relevance: Ensure that the hashtags you use are relevant to the content of your post. Using unrelated or excessive hashtags can be seen as spammy and may result in lower engagement.
- Popularity: Consider using a mix of popular and niche-specific hashtags. Popular tags have a larger audience but can also be highly competitive, while niche tags may have a smaller audience but are more targeted.
- Research: Before using a hashtag, research its usage and popularity to ensure it aligns with your objectives and target audience.
- Analytics: Monitor the performance of your hashtags using social media analytics tools. This will help you identify which hashtags are driving the most engagement and adjust your strategy accordingly.
Creating a two-variable data table in Excel is a powerful tool that allows you to analyze various scenarios and make more informed decisions. By inputting different values for two variables, you can quickly observe how they interact and how changing one variable affects the outcome. This feature is particularly useful in financial modeling, project management, and data analysis.
Throughout this article, we have explored the step-by-step process of creating a two-variable data table in Excel, from setting up the data range to inputting the formulas. We have learned how to interpret the results and make sense of the data table. With this knowledge, you can now confidently use this feature to explore various scenarios and gain insights into complex problems.
By leveraging the power of two-variable data tables in Excel, you can make informed decisions, optimize your strategies, and save time in analysis. Whether you are a business professional, a student, or someone seeking to deepen your Excel skills, mastering the art of creating two-variable data tables will undoubtedly enhance your data analysis capabilities.
FAQs
1. What is a Two Variable Data Table in Excel?
A Two Variable Data Table in Excel is a powerful tool that allows you to analyze the impact of two different input variables on a formula or calculation. By setting up a data table, you can view multiple scenarios and quickly determine how changing the values of the two variables will affect the outcome. This analysis can be particularly useful when making business decisions or conducting sensitivity analysis.
2. How do I create a Two Variable Data Table in Excel?
Creating a Two Variable Data Table in Excel involves a few simple steps. First, you need to set up the input values for the two variables in a separate area of your worksheet. Next, you input the formula or calculation that you want to analyze. Then, you select the range of possible values for each variable and set up the data table using the Data Table feature in Excel. Finally, you view the results of the data table, which will show how changing the values of the two variables impact the formula or calculation.
3. Can I use a Two Variable Data Table to analyze more than two variables?
No, a Two Variable Data Table in Excel specifically analyzes the impact of two variables on a formula or calculation. If you want to analyze more than two variables, you would need to create multiple data tables or use a different method, such as scenario analysis or the Solver tool in Excel.
4. Can I use a Two Variable Data Table with non-numeric inputs?
No, a Two Variable Data Table in Excel requires numeric inputs for the variables. If you have non-numeric inputs, such as text or dates, you will need to convert them to numeric values before setting up the data table. Excel provides various functions, such as DATEVALUE or VALUE, that can help convert non-numeric data to numeric format.
5. How do I interpret the results of a Two Variable Data Table?
The results of a Two Variable Data Table in Excel are displayed in a grid format, with one variable’s values listed as the row headings and the other variable’s values listed as the column headings. The cells within the data table show the calculated results of the formula or calculation for each combination of the two variables. By analyzing the values in the data table, you can identify trends, patterns, or optimal combinations of the variables that maximize or minimize the outcome you are analyzing.