
Are you looking to analyze multiple scenarios in your data using Excel? One handy tool that Excel offers is the One Variable Data Table. This powerful feature allows you to input different values for a single variable and instantly see how it affects the results of your calculations. Whether you’re a business analyst, finance professional, or a student working on a project, learning how to create a One Variable Data Table in Excel can save you a tremendous amount of time and effort when analyzing your data. In this article, we’ll walk you through the step-by-step process of creating a One Variable Data Table in Excel, so that you can make more informed decisions and gain valuable insights from your data.
Inside This Article
- Understanding One Variable Data Tables in Excel
- Defining the Variables for the Data Table
- Setting Up the Data Table Structure
- Using the One Variable Data Table Function in Excel
- Conclusion
- FAQs
Understanding One Variable Data Tables in Excel
One variable data tables in Excel are a powerful tool that allows you to analyze how changing one input variable can impact the result of a formula or calculation. They provide a convenient way to visualize and understand the relationship between input and output values, making it easier to make informed decisions based on various scenarios.
With one variable data tables, you can input different values for a single variable and see the corresponding results in a structured and organized manner. This enables you to quickly identify patterns, trends, and outliers, facilitating data-driven decision-making.
These data tables are especially useful when dealing with complex calculations or when you need to perform sensitivity analysis. By adjusting the variable across a range of values, you can observe the effect on the calculated output, allowing you to explore different scenarios and understand the potential impact of varying inputs.
One variable data tables are commonly used in finance, engineering, statistics, and other fields where numerical analysis is crucial. They can help you assess the best-case and worst-case scenarios, evaluate the sensitivity of a model to changes, and identify the optimum values for your variables.
To create a one variable data table in Excel, you need to define the variables and set up the data table structure, which will be explained in more detail in subsequent sections of this article. Once set up, you can easily use the one variable data table function to generate the desired results.
By understanding how to create and utilize one variable data tables in Excel, you can enhance your data analysis capabilities and gain valuable insights into the relationships between variables. Whether you are a financial analyst, a project manager, or simply an Excel enthusiast, mastering one variable data tables can greatly streamline your decision-making process and enable you to make more informed choices.
Defining the Variables for the Data Table
Before creating a one variable data table in Excel, it is important to define the variables that will be used in the table. These variables include the input value or range, and the output formula or function.
The input value or range is the cell or range of cells that will be varied in the data table. This is the value that will be changed to observe the effect on the output formula or function. It could be a single cell or a range of cells.
The output formula or function is the calculation or formula that will be used to generate the values in the data table. It is the formula that depends on the input variable and produces a result based on different values of the input.
When defining the variables, it is important to ensure that the input value or range is linked to the output formula or function. This ensures that changes to the input value or range are reflected in the output formula or function.
Additionally, make sure that the input value or range and the output formula or function are correctly referenced in the data table setup. Incorrect references can result in inaccurate data table results.
To define the variables for the data table, simply select the input value or range and the output formula or function. Link them together and verify the correct references. Once the variables are defined, you are ready to set up the structure for the data table in Excel.
Setting Up the Data Table Structure
Before you can use a one variable data table in Excel, you need to set up the structure of the table. This involves determining the input values, the output values, and the formula or function that will be used to calculate the results.
The first step is to identify the input values for your data table. These are the variables that you want to analyze and compare against different scenarios. For example, if you are analyzing sales data, your input values could be different sales targets or discount rates.
Once you have identified your input values, you need to list them in a column or row in your spreadsheet. It’s important to make sure that these values are organized and sequentially arranged to avoid any errors in the data table.
Next, you need to determine the output values that will be calculated based on the input values. These are the results that you want to see for each scenario in your data table. For example, if you are analyzing sales data, your output values could be the total sales amount or the profit margin.
To set up the data table structure, you need to create a row or column for your output values. You can label these cells with the appropriate headers to make it clear what each output value represents. It’s important to ensure that the output values are aligned with the corresponding input values to maintain data integrity.
Finally, you need to write the formula or function that will calculate the output values based on the input values. This formula or function will be entered in the cell that corresponds to the first output value in your data table. It should reference the appropriate cells that contain the input values and use the proper operators and functions to perform the desired calculations.
Make sure to test the formula or function by manually entering values for the input variables and confirming that the output values are calculated correctly. Once you are satisfied with the accuracy of the data table structure, you can proceed to use the one variable data table function in Excel to generate the results for different scenarios.
Using the One Variable Data Table Function in Excel
When working with complex spreadsheets and data analysis in Excel, the one variable data table function can be a powerful tool. This function allows you to explore different scenarios by changing a single input variable and observing the impact on other cells or formulas in the table.
To use the one variable data table function in Excel, follow these steps:
- Select the range of cells where you want to display the results. This range should include at least one cell where you will enter the input values.
- Enter your desired input values in a column or row adjacent to the results range. Make sure that these input values are arranged in either ascending or descending order.
- In the cell where you want to display the first set of results, enter the formula or function that you want to evaluate.
- Select the entire results range, including the cell containing the formula and the adjacent input values.
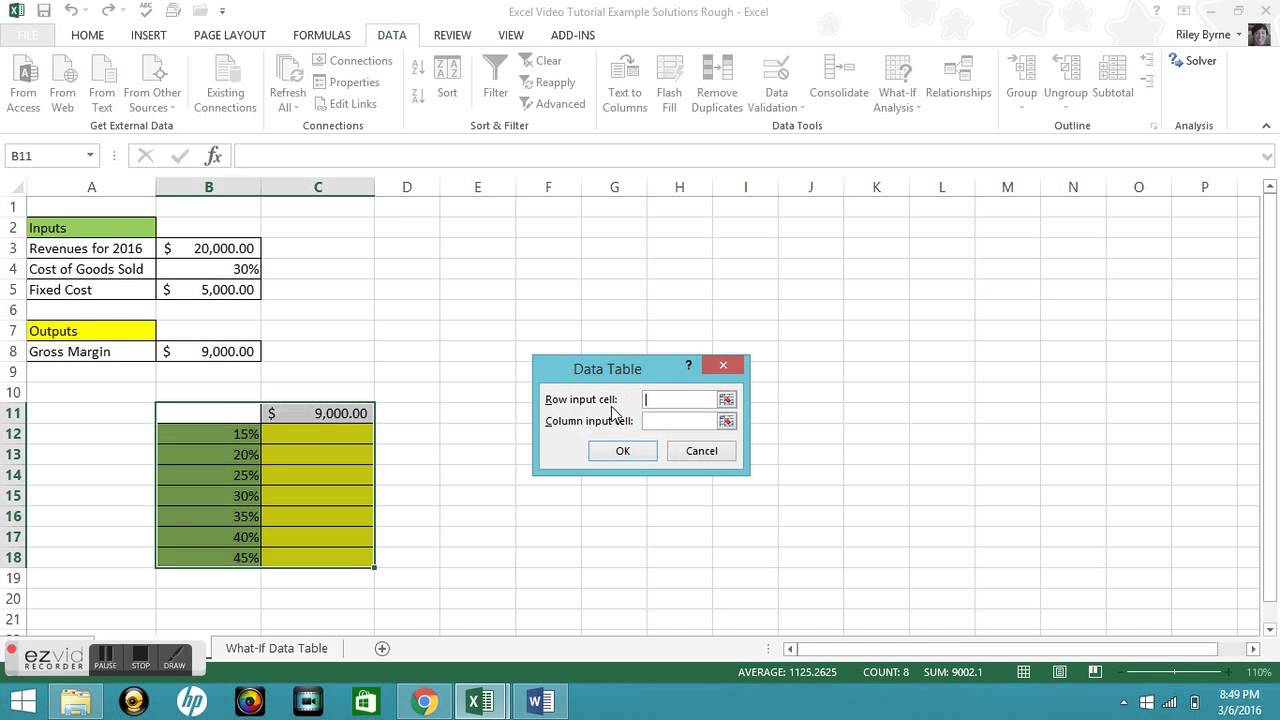
- Go to the “Data” tab in the Excel ribbon and click on “What-If Analysis” from the “Data Tools” group.
- Select “Data Table” from the drop-down menu.
- In the “Column input cell” box, enter the reference to the cell that contains the input variable you want to change.
- Click “OK” to create the one variable data table.
Once you have followed these steps, Excel will automatically generate the results for each input value in the table. This allows you to quickly see how changing the input variable affects the formula or function you are evaluating.
It’s important to note that the one variable data table function only works with formulas or functions that return a single result. If your formula or function returns multiple values, you may need to adjust your approach or use a different method to analyze your data.
In addition, remember to update the input values if necessary. If you want to see how different input values impact your results, simply change the values in the input column or row, and Excel will automatically update the corresponding results in the data table.
The one variable data table function in Excel is an invaluable tool for performing sensitivity analysis, scenario planning, and other what-if analyses. By quickly and easily exploring different input values and their impacts on your formulas or functions, you can make more informed decisions and gain deeper insights into your data.
So the next time you find yourself needing to analyze the impact of a single input variable in Excel, don’t hesitate to use the one variable data table function. It will save you time and effort while providing valuable insights into your data.
Conclusion
In conclusion, creating a one-variable data table in Excel can be a valuable tool for analyzing and comparing different scenarios. By inputting the desired values and observing the resulting outputs, users can easily perform sensitivity analysis and gain valuable insights. This feature allows for efficient decision-making and helps in understanding the impact of various inputs on the overall outcome.
Whether you’re a business professional, a student, or simply someone who wants to optimize their data analysis skills, mastering the creation of one-variable data tables is a worthwhile endeavor. Excel provides a user-friendly interface and powerful functionalities that make it accessible for users of all skill levels.
So, give it a try! Experiment with different inputs, observe the outcomes, and uncover valuable insights within your data. With this knowledge and skill in your toolkit, you’ll be well-equipped to make informed decisions and drive greater success in your endeavors.
FAQs
1. What is a one variable data table in Excel?
A one variable data table in Excel is a useful tool that allows you to explore different possibilities and see how changing one variable can affect the outcomes in a spreadsheet model. It helps you analyze the impact of various input values on a formula or set of formulas, making it easier to assess different scenarios and make informed decisions.
2. How do I create a one variable data table in Excel?
To create a one variable data table in Excel, follow these steps:
- Select a range of cells where you want to display the results of the data table.
- In the first row of the selected range, enter the different values you want to test for the variable.
- In the first column of the selected range, enter the formula or formulas that depend on the variable.
- Select the entire range, including the formula and the values.
- Go to the “Data” tab in the Excel ribbon and click on the “What-If Analysis” button.
- Select “Data Table” from the drop-down menu.
- In the “Column input cell” box, enter the reference to the cell that contains the variable you want to change.
- Click “OK” to create the data table.
3. Can I use a data table for more than one variable?
No, a one variable data table is designed to analyze the impact of only one variable on a formula or set of formulas. If you want to analyze the impact of multiple variables, you would need to create a two variable or multi-variable data table in Excel.
4. What are the benefits of using a one variable data table in Excel?
Using a one variable data table in Excel offers several benefits, including:
- Quickly assessing different scenarios by changing the variable value.
- Understanding the relationship between the variable and the outcomes of a formula.
- Making informed decisions based on the analysis of different possibilities.
- Identifying optimal values for a variable to achieve desired results.
- Enhancing the visual representation of data and analysis in a spreadsheet.
5. Can I use a one variable data table in Excel for complex formulas?
Yes, you can use a one variable data table in Excel for complex formulas. The data table will calculate the results for each value in the variable range, regardless of the complexity of the formulas. It provides a convenient way to analyze the impact of different variable values on the outcomes, even for complex calculations.