
When it comes to making informed decisions, data analysis plays a crucial role. The ability to interpret data accurately can provide valuable insights and guide strategic actions. However, for those who are not well-versed in the field of data analysis, it can be an intimidating task.
In this article, we will demystify the process of interpreting data analysis to help you better understand the significance of data and how to use it effectively. Whether you are a business owner, a student, or simply someone interested in unlocking the potential of data, this guide will equip you with the knowledge and tools to navigate through data analysis with confidence.
Inside This Article
- Overview of Data Analysis
- Importance of Data Interpretation
- Key Steps in Data Analysis
- Common Challenges in Interpreting Data Analysis
- Conclusion
- FAQs
Overview of Data Analysis
Data analysis is the process of inspecting, processing, and interpreting data to uncover meaningful insights and trends. In today’s data-driven world, organizations and individuals collect vast amounts of data from various sources such as surveys, sensors, social media, and transactions. However, data alone is useless without proper analysis and interpretation. This is where data analysis comes into play.
The goal of data analysis is to extract valuable information and knowledge from raw data and transform it into actionable insights. It involves organizing, structuring, and cleaning data to make it suitable for analysis. By applying statistical techniques, mathematical models, and visualization tools, analysts can identify patterns, correlations, and outliers within the data.
Data analysis plays a crucial role in decision-making, problem-solving, and strategic planning. It helps businesses improve operational efficiency, optimize marketing campaigns, identify customer preferences, and forecast future trends. In research and academia, data analysis aids in hypothesis testing, validating theories, and contributing to scientific advancements.
There are various methods and techniques used in data analysis, including descriptive statistics, inferential statistics, data mining, machine learning, and predictive modeling. Each method serves a specific purpose and is selected based on the nature of the data and the objectives of the analysis.
Moreover, data analysis is not a one-time process. It is iterative, meaning that analysts often refine their approaches and models based on feedback, new data, and changing requirements. This continuous cycle of analysis ensures that organizations stay ahead of the competition and make informed decisions based on the most up-to-date insights.
Importance of Data Interpretation
Data interpretation plays a crucial role in the field of data analysis. It involves analyzing and making sense of the data collected to derive meaningful insights and make informed decisions. Without proper data interpretation, raw data remains just numbers and figures, lacking any real significance. Here are several reasons why data interpretation is of paramount importance:
1. Making Informed Decisions: Data interpretation allows us to make informed decisions based on the insights derived from the data. By analyzing and interpreting the data, we can identify patterns, trends, and relationships that can guide us in making better choices. Whether it’s in business, research, or everyday life, data interpretation empowers us to make data-driven decisions.
2. Identifying Opportunities and Challenges: Data interpretation helps us identify potential opportunities and challenges within the data. By analyzing the data, we can spot trends, market gaps, or customer preferences that can be leveraged for business growth. Additionally, data interpretation helps us detect any anomalies or obstacles that need to be addressed for effective problem-solving.
3. Understanding Customer Behavior: The interpretation of data provides insights into customer behavior and preferences. By analyzing customer data, businesses can understand buying patterns, customer satisfaction levels, and factors influencing customer decisions. This understanding allows companies to tailor their products, services, and marketing strategies to meet customer needs and enhance customer satisfaction.
4. Monitoring and Evaluating Performance: Data interpretation is vital for monitoring and evaluating performance. By analyzing performance data, businesses can track progress, measure success, and identify areas of improvement. This helps in making data-driven decisions for optimizing operations, increasing efficiency, and improving overall performance.
5. Predictive Analysis: Effective data interpretation enables predictive analysis, which is essential for forecasting future trends and outcomes. By analyzing historical data and identifying patterns, businesses can make predictions about future market trends, customer behavior, and industry developments. This foresight enables proactive decision-making and helps companies stay ahead of the curve.
6. Quality Assurance and Risk Management: Data interpretation is crucial for quality assurance and risk management. By analyzing data related to product defects, customer complaints, or operational issues, businesses can identify areas of improvement and implement strategies to enhance product quality or mitigate risks. Timely data interpretation can help prevent potential risks and ensure the delivery of high-quality products and services.
7. Driving Innovation and Research: Data interpretation is essential for driving innovation and research. By analyzing data, researchers can uncover new insights, discover patterns, and make scientific discoveries. Businesses can also use data interpretation to identify market trends and consumer preferences, leading to innovative product development and improved customer experiences.
Overall, data interpretation is not only about analyzing numbers; it is about extracting valuable insights and translating them into actionable strategies. It empowers businesses, researchers, and individuals to use data effectively, make informed decisions, drive innovation, and achieve success.
Key Steps in Data Analysis
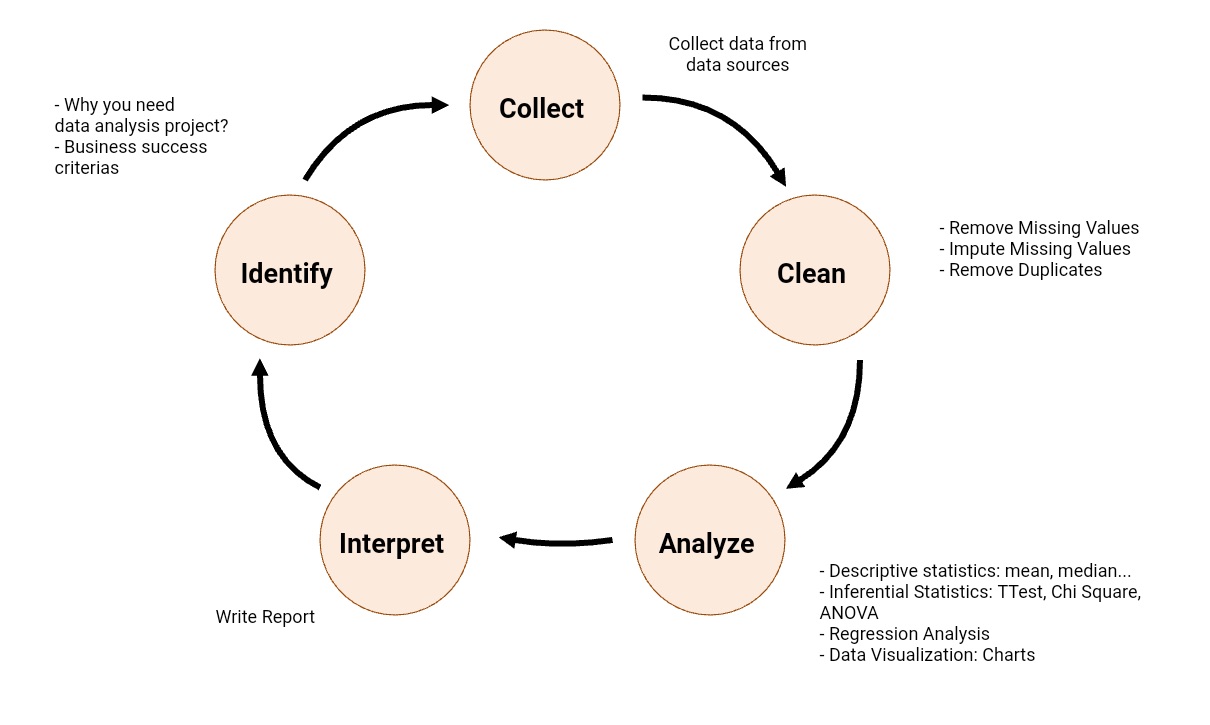
Data analysis is a crucial process in extracting valuable insights from raw data. By following a structured approach, you can ensure accurate and meaningful interpretations. Here are the key steps to effectively analyze data:
- Define your objectives: Before diving into data analysis, clearly define your objectives. Determine what you aim to achieve and the questions you want to answer through the data. By identifying specific goals, you can focus your analysis on relevant aspects.
- Collect and clean the data: The next step is to gather appropriate data for analysis. Ensure that you have collected all the necessary information and remove any duplicate or irrelevant data. Cleaning the data involves checking for errors, inconsistencies, and missing values, and taking corrective measures.
- Explore and visualize the data: Once the data is prepared, it’s time to explore and visualize it. This step involves examining the data trends, patterns, and relationships using various statistical methods and charts. Visualizations such as histograms, scatter plots, and bar graphs can provide an intuitive understanding of the data.
- Apply data analysis techniques: In this step, apply appropriate data analysis techniques to derive insights from the data. This may include statistical analysis, regression modeling, clustering, or machine learning algorithms. Select the techniques based on your objectives and the type of data you are working with.
- Interpret the results: Once the analysis is complete, interpret the results in the context of your objectives. Look for significant findings, trends, or correlations that can answer your research questions. It’s important to critically evaluate the results and ensure they align with the initial objectives.
- Communicate and present the findings: The final step is to effectively communicate and present your findings. Use visualizations, charts, and clear language to convey the insights in a compelling and easily understandable manner. Tailor your presentation to the intended audience, highlighting the key takeaways.
By following these key steps, you will be able to make informed decisions based on accurate data analysis. Remember that data interpretation requires a combination of technical skills, critical thinking, and domain knowledge, all of which can be enhanced through practice and experience.
Common Challenges in Interpreting Data Analysis
Interpreting data analysis can be a complex task that involves extracting meaningful insights from a large volume of data. While data analysis provides valuable information, there are several common challenges that one may encounter when interpreting the results. Understanding these challenges is crucial in order to ensure accurate and reliable data interpretation. Let’s explore some of the common challenges in interpreting data analysis.
1. Data Overload: One of the major challenges in data analysis is dealing with data overload. With the exponential growth of data, it can be overwhelming to sift through a huge dataset and extract relevant information. It is important to have a clear understanding of what specific insights you are looking for and focus on analyzing the relevant variables.
2. Data Quality: The accuracy and quality of data are essential for meaningful interpretation. Poor data quality, such as missing values, inconsistent formatting, or outliers, can impact the validity of the analysis. It is crucial to address data quality issues before proceeding with the interpretation to ensure accurate and reliable results.
3. Data Bias: Another challenge is dealing with data bias. Bias can occur when the data collected or the analysis method used favor certain outcomes or groups, resulting in skewed interpretations. It is important to be aware of potential biases and take steps to mitigate them in order to ensure unbiased and objective data analysis.
4. Complexity of Analysis Techniques: Interpreting data analysis often involves applying various complex statistical techniques to analyze and interpret the data. Understanding these techniques can be a challenge, especially for individuals who do not have a background in statistics. It is essential to have a good understanding of the analysis techniques being used or seek the assistance of a data analysis expert.
5. Lack of Context: Without proper context, data analysis can be misleading. It is important to consider the broader context surrounding the data, such as the business objectives, industry trends, and external factors. Properly contextualizing the analysis results helps to ensure accurate interpretation and meaningful insights.
6. Visualization: Communicating the results of data analysis effectively is another challenge. Presenting the findings in a clear, visually appealing manner can help facilitate understanding and interpretation. Utilizing appropriate data visualization techniques, such as charts, graphs, and infographics, can enhance the interpretation of the data analysis results.
7. Changing Data Landscape: The data landscape is constantly evolving, with new data sources and technologies emerging. Keeping up with these changes and staying updated on the latest data analysis techniques can be a challenge. Continuous learning and adaptation are necessary to effectively interpret data analysis in a rapidly changing environment.
Conclusion
Data analysis is a powerful tool that allows us to uncover valuable insights from raw data. By applying various statistical techniques, visualization tools, and analytical methods, we can make informed decisions, increase efficiency, and drive growth across different industries and sectors.
Interpreting data analysis requires a combination of technical expertise, critical thinking, and domain knowledge. It is important to understand the context, ask the right questions, and draw meaningful conclusions to derive actionable insights.
Whether you are a business professional, a researcher, or an aspiring data scientist, honing your data analysis skills will give you a competitive edge in today’s data-driven world. So, embrace the power of data analysis, explore new patterns and trends, and unlock the limitless possibilities that await!
FAQs
Q: What is data analysis?
Data analysis is the process of examining, transforming, and interpreting data to uncover patterns, insights, and trends. It involves using various statistical and analytical techniques to extract meaningful information from large datasets.
Q: Why is data analysis important?
Data analysis plays a crucial role in making informed decisions, identifying patterns, and understanding the performance of businesses or processes. It can help organizations gain a competitive edge, detect problems, improve efficiency, and provide valuable insights for strategic planning.
Q: What are the different methods of data analysis?
There are several methods of data analysis, including descriptive analysis, inferential analysis, exploratory data analysis, predictive analysis, and prescriptive analysis. Each method has its own purpose and involves different techniques and tools to extract and interpret data.
Q: What tools can I use for data analysis?
There are numerous tools available for data analysis, depending on your specific needs and level of expertise. Some popular tools include Excel, R, Python, SQL, Tableau, and Power BI. These tools offer functionalities for data cleaning, visualization, statistical analysis, and machine learning algorithms.
Q: How can I improve my data analysis skills?
To enhance your data analysis skills, it’s essential to practice regularly and continue learning. You can take online courses, attend workshops, join data analysis communities, and work on real-world projects. It’s also helpful to stay updated with the latest trends and techniques in data analysis through industry publications and blogs.