
If you’re looking for a powerful tool to visualize your data and create stunning reports, you’re in luck! Google Data Studio is an incredible platform that integrates seamlessly with Google Sheets, allowing you to transform your raw data into beautiful and interactive dashboards.
Data Studio offers a user-friendly interface that makes it easy for both beginners and seasoned professionals to create dynamic and visually appealing reports. With its drag-and-drop functionality and customizable features, you can quickly and effortlessly build charts, graphs, tables, and maps to present your data in a meaningful way.
In this article, we’ll guide you through the process of using Data Studio with Google Sheets. From connecting your data to designing and sharing your reports, you’ll gain a comprehensive understanding of how to make the most of this powerful tool. So, let’s dive in and unlock the potential of Data Studio and Google Sheets for your data visualization needs!
Inside This Article
- Overview
- Connecting Google Sheets to Data Studio
- Creating a Data Source in Data Studio
- Building Data Visualizations in Data Studio
- Conclusion
- FAQs
Overview
Data Studio is a powerful tool that allows you to create visually appealing and interactive reports and dashboards. With its seamless integration with Google Sheets, you can easily connect your data and harness its full potential. Whether you’re a business owner, marketer, or analyst, Data Studio with Google Sheets can help you gain valuable insights and make data-driven decisions.
By using Data Studio with Google Sheets, you can consolidate data from multiple sources into one centralized location. This makes it easier to analyze and visualize the data, saving you time and effort. Additionally, Data Studio offers a wide range of customization options, allowing you to tailor your reports and dashboards to align with your specific needs and branding.
The process of using Data Studio with Google Sheets is straightforward and user-friendly. All you need is a Google account to get started. Once you have connected Google Sheets as a data source in Data Studio, you can begin building your reports and dashboards by dragging and dropping various components onto the canvas.
Data Studio also offers a wide variety of data visualization options, such as charts, tables, and maps, which can be customized and configured to present your data in a clear and compelling manner. With its interactive features, viewers can interact with the data visualizations, zooming in, filtering, and exploring the data to gain deeper insights.
Another advantage of using Data Studio with Google Sheets is the ability to collaborate and share your reports and dashboards with others. You can easily grant permissions to specific individuals or teams, allowing them to view, edit, or comment on the reports. This promotes collaboration and opens up opportunities for sharing knowledge and insights.
Overall, Data Studio with Google Sheets is a powerful tool that empowers you to transform raw data into visually stunning reports and dashboards. With its user-friendly interface, seamless integration, and customization options, it is an essential tool for anyone looking to leverage the power of data analysis and visualization. So why not give it a try and unlock the full potential of your data?
Connecting Google Sheets to Data Studio
Google Data Studio is a powerful tool that allows you to create visually stunning and interactive reports and dashboards. One of the key features of Data Studio is its ability to connect to various data sources, including Google Sheets.
Connecting Google Sheets to Data Studio is a straightforward process that enables you to leverage the data in your spreadsheets for creating insightful visualizations. By establishing this connection, you can easily update your reports and dashboards with real-time data from your Google Sheets.
Here’s a step-by-step guide on how to connect Google Sheets to Data Studio:
- Start by opening Data Studio and create a new report or open an existing one.
- Click on the “Data” tab located in the top menu bar.
- Under the “Connectors” section, click on the “Google Sheets” icon.
- A pop-up window will appear, asking you to select the Google Sheets document you want to connect. Choose the desired spreadsheet from the list.
- Data Studio will now retrieve the data from the selected spreadsheet. You can select which sheet within the document you want to use, as well as customize the data range if needed.
- Once you’ve selected the desired options, click on the “Connect” button.
- Data Studio will now establish the connection to your Google Sheets document. Depending on the size of your dataset, this may take a few moments.
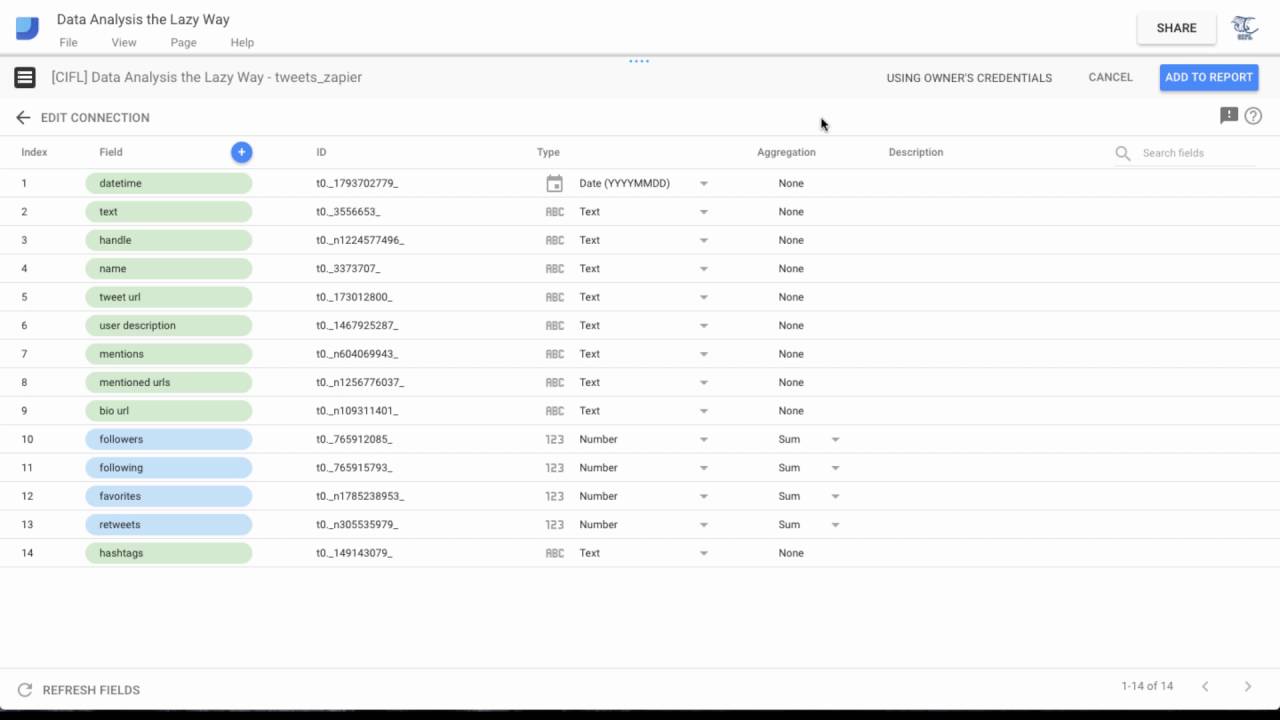
- After the connection is established, you will be presented with a preview of your data. Data Studio will automatically detect the data types and suggest appropriate dimensions and metrics.
- Review the data preview and make any necessary adjustments or mappings. You can rename fields, change data types, or add calculated fields.
- Once you’re satisfied with the data preview, click on the “Add to Report” button to add the data source to your report.
That’s it! You have successfully connected your Google Sheets to Data Studio. Now, you can start building stunning visualizations using the data from your spreadsheets.
By connecting Google Sheets to Data Studio, you unlock the power of real-time data analysis and visualization. It allows you to effortlessly create dynamic reports and share them with your team or clients.
Remember, the connection between Google Sheets and Data Studio is live, meaning any updates or changes you make to your Google Sheets will be reflected in your Data Studio reports. This ensures that your reports are always up-to-date and provide accurate insights.
Creating a Data Source in Data Studio
Once you have connected Google Sheets to Data Studio, the next step is to create a data source. A data source in Data Studio acts as a bridge between your raw data in Google Sheets and the visualizations you want to create.
To create a data source, go to the Data Studio homepage and click on “Create” in the top right corner. Then, select “Data Source” from the dropdown menu.
Next, you will be prompted to choose the type of data source you want to create. Since we have already connected Google Sheets, select “Google Sheets” as the data source type.
After selecting Google Sheets, you will be prompted to choose the specific spreadsheet and sheet that you want to use as your data source. Simply select the desired spreadsheet and sheet from the dropdown menus.
Once you have selected the spreadsheet and sheet, Data Studio will retrieve the data and display it in a table format. Here, you can review the columns and data types to ensure everything is accurate. If needed, you can also edit the field names, remove columns, or change the data types.
Once you are satisfied with the data source configuration, click on the “Connect” button to proceed. Data Studio will then create the data source and take you to the report editor where you can start building your visualizations.
Keep in mind that the data from your Google Sheets will be automatically refreshed in Data Studio, ensuring that your visualizations always reflect the most up-to-date data. However, if you make any changes to the spreadsheet structure or data types, you will need to manually refresh the data source in Data Studio.
Now that you have created a data source in Data Studio, you can begin exploring the various data visualization options available to build insightful and interactive reports.
Building Data Visualizations in Data Studio
Once you have connected Google Sheets to Data Studio and created a data source, you can start building data visualizations in Data Studio. With its intuitive drag-and-drop interface and robust features, Data Studio makes it easy to create dynamic and interactive visual representations of your data.
To get started, navigate to the report in Data Studio where you want to add data visualizations. Click on the ‘Add a chart’ button in the toolbar to open the Chart Gallery, which offers a wide range of chart types to choose from.
When selecting a chart type, consider the nature of your data and the story you want to convey. Whether it’s a bar chart, line chart, pie chart, or scatter plot, each chart type has its unique strengths in representing different types of data.
After selecting a chart type, you can customize it to suit your needs. Data Studio offers a variety of options to modify the appearance and behavior of your visualizations. You can change colors, fonts, axis labels, and legends to align with your branding or presentation requirements.
Data Studio also allows you to apply various filters and date ranges to your visualizations. You can filter the data based on specific dimensions or conditions, enabling you to focus on specific subsets of data or compare different segments. Additionally, you can set date ranges to analyze data over specific time periods.
Furthermore, you can apply aggregate functions like sum, average, or count to calculate metrics and create calculated fields to perform calculations on your data. These functionalities help you derive valuable insights and present them in a concise and meaningful way.
To enhance the interactivity of your visualizations, you can add features such as drill-downs, controls, and data highlighting. Drill-downs allow users to explore additional levels of detail by clicking on specific elements in the visualization. Controls enable users to filter or toggle specific data points, and data highlighting empowers users to focus on specific data points by emphasizing them visually.
Once you have customized your visualizations, you can arrange them on the report canvas to create a compelling story. Data Studio provides a flexible and responsive layout system, enabling you to align, resize, and layer visualizations to create a visually appealing and informative report.
Finally, you can share your reports with others, collaborate on them, and even embed them on websites or in other applications. Data Studio allows you to control the viewing and editing permissions for each user, ensuring that the right people have access to the right information.
Conclusion
Using Data Studio with Google Sheets provides a powerful tool for visualizing and analyzing data. By integrating these two platforms, users can create dynamic and interactive reports and dashboards to gain valuable insights. Whether you’re tracking sales data, analyzing website traffic, or monitoring social media metrics, Data Studio and Google Sheets offer the flexibility and customization you need.
With its user-friendly interface and extensive range of features, Data Studio simplifies the process of data visualization, making it accessible to users of all levels of expertise. The seamless integration with Google Sheets allows for real-time data updates and ensures that your reports are always up-to-date.
So, if you’re looking for a powerful and intuitive solution to effectively communicate your data findings, consider utilizing Data Studio with Google Sheets. Unlock the full potential of your data and make informed business decisions with this dynamic duo.
FAQs
1. What is Data Studio?
Data Studio is a powerful visualization tool developed by Google that allows users to create interactive and customizable reports and dashboards. It integrates seamlessly with other Google products like Google Sheets, making it easy to import data and generate insightful visualizations.
2. How can I use Data Studio with Google Sheets?
To use Data Studio with Google Sheets, you can connect your Google Sheets data as a data source within Data Studio. This allows you to pull data directly from your Google Sheets and use it to create dynamic and interactive reports. You can also schedule automatic data refreshes to ensure your reports are always up-to-date.
3. What are the benefits of using Data Studio with Google Sheets?
Using Data Studio with Google Sheets offers several benefits. Firstly, it provides a user-friendly interface for designing visually appealing and interactive reports. Secondly, it allows for real-time data updates, ensuring that your reports are always accurate. Additionally, Data Studio offers a wide range of customization options, enabling you to create reports that meet your specific needs and requirements.
4. Can I collaborate with others when using Data Studio with Google Sheets?
Yes, you can collaborate with others when using Data Studio with Google Sheets. Data Studio supports real-time collaboration, allowing multiple users to work on the same report simultaneously. This makes it easy to collaborate with team members, stakeholders, or clients, ensuring that everyone has access to the most up-to-date information.
5. Are there any limitations to using Data Studio with Google Sheets?
While Data Studio offers a wide range of features and benefits, there are some limitations to be aware of. For instance, there are limitations on the amount of data that can be loaded into a report from Google Sheets. Additionally, certain advanced calculations or data transformations may require pre-processing in Google Sheets before being used in Data Studio. It’s important to familiarize yourself with these limitations to ensure that Data Studio meets your specific requirements.