
PowerPoint presentations are an effective way to convey information and engage your audience. One key element that can enhance your presentations is the ability to embed data directly into your slides. This allows you to seamlessly integrate charts, tables, and graphs, making your data more accessible and visually appealing. Whether you are a business professional presenting quarterly sales figures or a student showcasing research findings, embedding data in PowerPoint can elevate your presentation to the next level. In this article, we will explore different methods to embed data in PowerPoint, providing you with step-by-step instructions and tips to effectively incorporate data into your slides. Let’s dive in and discover how you can make your presentations more informative and impactful!
Inside This Article
- # How To Embed Data In PowerPoint
- Inserting Excel Spreadsheet
- Linking Excel Data
- Embedding Charts and Graphs
- Inserting Live Web Content
- Conclusion
- FAQs
# How To Embed Data In PowerPoint
PowerPoint is a powerful tool for creating visually appealing presentations. One of its key features is the ability to embed data, such as spreadsheets, charts, and graphs, directly into your slides. This not only enhances the visual appeal of your presentation but also allows you to update the data seamlessly without having to switch back and forth between different applications.
In this article, we will explore different methods of embedding data in PowerPoint and how to make the most of this feature to create engaging and dynamic presentations.
Inserting Excel Spreadsheet
If you have data stored in Microsoft Excel, you can easily insert an entire Excel spreadsheet into your PowerPoint slide. This is especially useful when you want to display a large amount of data or when you want to maintain the functionality of the spreadsheet within your presentation.
To insert an Excel spreadsheet, open PowerPoint and navigate to the slide where you want to insert the data. Go to the “Insert” tab and click on “Object” in the “Text” group. In the “Object” dialog box, select “Create from file” and browse for the Excel file you want to insert. Once selected, click on “OK” and the Excel spreadsheet will be embedded in your slide.
Linking Excel Data
Linking Excel data is a great option when you want to display real-time information in your PowerPoint presentation. Instead of embedding the entire spreadsheet, you can simply link a range of cells or a specific chart from an Excel file into your slide.
To link Excel data, open both PowerPoint and Excel. Copy the range of cells or chart that you want to link in Excel. In PowerPoint, navigate to the slide where you want to display the linked data and go to the “Home” tab. Click on the arrow next to the “Paste” button and select “Paste Special”. In the “Paste Special” dialog box, choose “Paste link” and select the desired format. Click on “OK”, and the Excel data will be linked to your PowerPoint slide.
Embedding Charts and Graphs
If you have already created charts or graphs in Excel, you can easily embed them in your PowerPoint presentation. This is especially useful when you want to showcase specific data visualizations without the need to display the entire spreadsheet.
To embed a chart or graph, open both PowerPoint and Excel. Select the desired chart or graph in Excel, and copy it. In PowerPoint, navigate to the slide where you want to insert the chart or graph and go to the “Home” tab. Click on the arrow next to the “Paste” button and choose “Paste Special”. In the “Paste Special” dialog box, select “Microsoft Office Excel Chart Object” and click on “OK”. The chart or graph will be embedded in your slide, and you can further customize it to fit your presentation.
Inserting Live Web Content
In addition to Excel data, PowerPoint also allows you to embed live web content, such as webpages or online videos. This is particularly useful when you want to showcase dynamic online content or when you need to reference external sources in your presentation.
To insert live web content, open PowerPoint and navigate to the slide where you want to insert the web content. Go to the “Insert” tab and click on “Web Page” or “Online Video” in the “Media” group. In the dialog box, enter the URL of the webpage or the embed code of the video. Click on “Insert” or “OK”, and the live web content will be embedded in your slide.
By using the various embedding methods in PowerPoint, you can transform your slides into dynamic and interactive presentations. Whether you want to showcase data from Excel, highlight specific charts or graphs, or include live web content, embedding data in PowerPoint allows you to create visually stunning and engaging presentations that captivate your audience.
Inserting Excel Spreadsheet
Excel spreadsheets are a powerful tool for organizing and analyzing data. They can also be integrated seamlessly into PowerPoint presentations, adding a dynamic element to your slides. Here’s how you can easily insert an Excel spreadsheet into your PowerPoint slide:
1. Open your PowerPoint presentation and navigate to the slide where you want to insert the Excel spreadsheet.
2. Go to the “Insert” tab in PowerPoint’s ribbon, then click on the “Table” drop-down menu.
3. Choose “Excel Spreadsheet” from the list of options. A blank Excel spreadsheet will appear on your slide.
4. To populate the spreadsheet with your data, either click inside each cell and manually enter your information, or copy and paste data from an existing Excel file.
5. Customize the appearance of your spreadsheet by adjusting the fonts, colors, and cell borders using PowerPoint’s formatting tools.
6. If you need to make any changes to the data in the spreadsheet, you can simply double-click on it to open the embedded Excel application. Make your edits, then click outside the spreadsheet to return to PowerPoint.
7. To resize or reposition the Excel spreadsheet on your slide, click and drag the edges or corners of the embedded object.
8. You can also add additional sheets to your Excel spreadsheet by clicking on the “+” button at the bottom of the embedded spreadsheet.
By embedding an Excel spreadsheet into your PowerPoint presentation, you can maintain a live link to your data. This means that any changes made to the original Excel file will automatically update in your PowerPoint slide. This is a useful feature if you frequently update or analyze data and want to present the most up-to-date information.
Note: If you are presenting your PowerPoint on a different computer that does not have Excel installed, the embedded spreadsheet may not be editable. In this case, it will be displayed as a static table.
Linking Excel Data
Linking Excel data to your PowerPoint presentation is a great way to ensure that the information you’re presenting is always up to date. Rather than manually updating the data in your PowerPoint slide, linking it to an Excel spreadsheet allows you to make changes in one place and have those changes automatically reflected in your presentation.
To link Excel data to PowerPoint, follow these simple steps:
- Open both your PowerPoint presentation and Excel spreadsheet.
- In PowerPoint, navigate to the slide where you want to insert the linked data.
- Go to the Insert tab and click on Object in the Text group.
- A dialog box will appear. Choose Create from file and click on Browse to locate and select your Excel spreadsheet.
- Check the box next to Link to create a link between the PowerPoint slide and the Excel spreadsheet.
- Click OK to insert the linked data into your PowerPoint slide.
Once the data is linked, any changes you make to the Excel spreadsheet will be reflected in your PowerPoint presentation. This is especially useful when working with data that is constantly updated or when collaborating with others on a project.
If you want to update the linked data manually, right-click on the linked object in PowerPoint and select Update Link. This will refresh the data with the latest changes from the Excel spreadsheet.
Linking Excel data to your PowerPoint presentation not only saves you time and effort but also ensures accuracy and consistency throughout your presentation. Whether you’re presenting sales figures, project timelines, or any other type of data, linking it to Excel will keep your information up to date and easily editable.
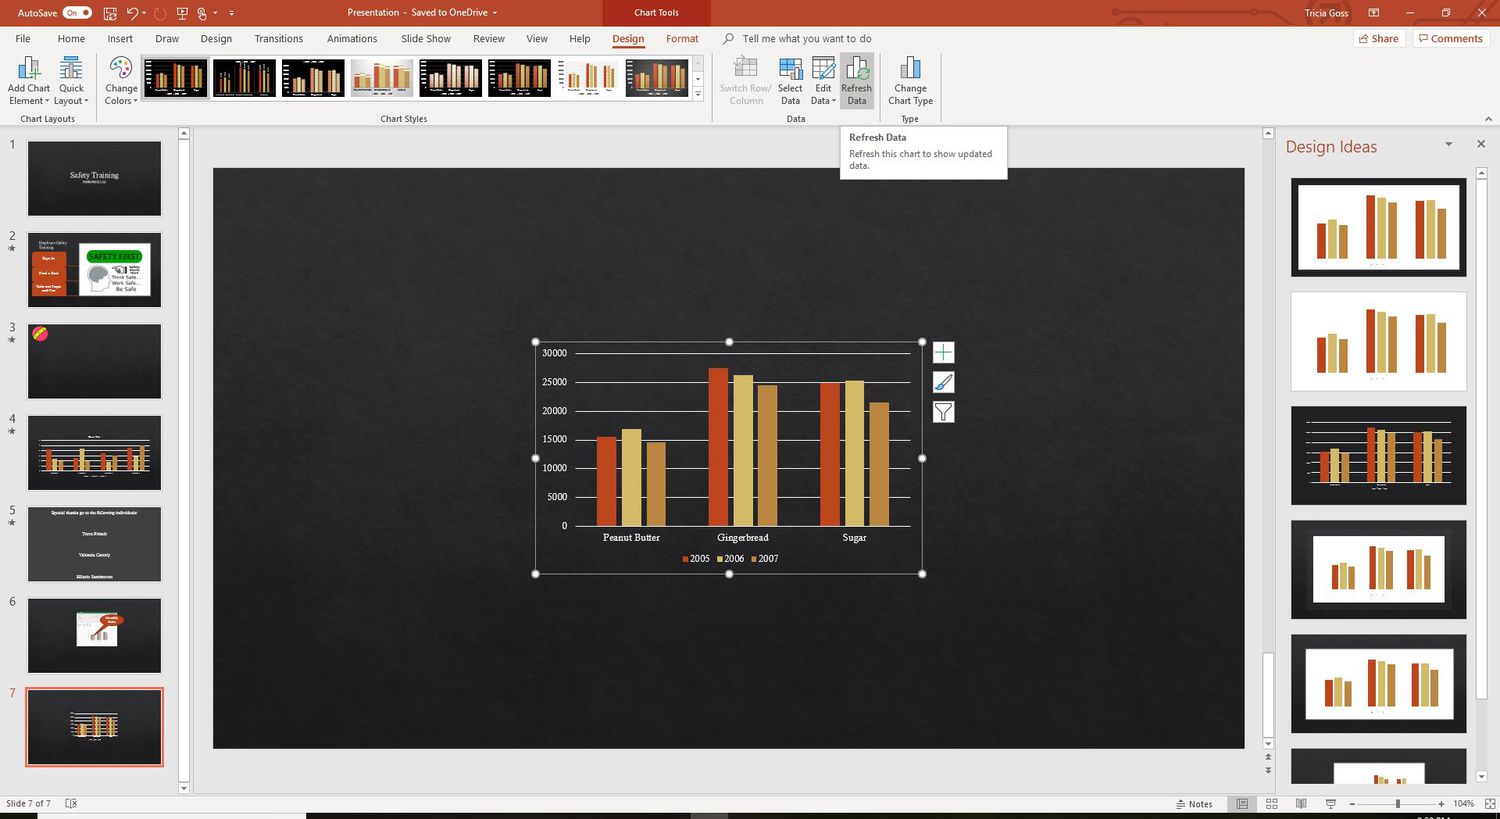
Embedding Charts and Graphs
When it comes to presenting data in PowerPoint, charts and graphs are essential tools to effectively convey information. With just a few simple steps, you can easily embed these visual elements into your PowerPoint slides.
To begin, open PowerPoint and navigate to the slide where you want to insert the chart or graph. Next, click on the “Insert” tab located at the top of the PowerPoint window. In the “Illustrations” group, you will find the “Chart” option. Click on it.
A dialog box will appear, and here you can choose the type of chart or graph you want to insert. PowerPoint offers a variety of options such as pie charts, bar graphs, line charts, and more. Select the type that best suits the data you want to present.
Once you’ve made your selection, click on the “OK” button. PowerPoint will now open Microsoft Excel, where you can enter your data directly into the provided spreadsheet. Alternatively, you can copy and paste data from an existing Excel file.
After entering your data, customize the chart or graph by adding titles, legends, axis labels, and other formatting options. You can do this by using the options available in the “Chart Tools” tab, which appears when you have the chart or graph selected.
Now that your chart or graph is complete, return to PowerPoint by either closing the Excel window or clicking on the PowerPoint icon on your taskbar. The chart or graph will be automatically inserted into your PowerPoint slide.
At this point, you can resize, reposition, or further customize the chart or graph to fit your slide’s layout. PowerPoint provides options to change the color scheme, style, and other visual elements of the chart or graph.
To update the embedded chart or graph with new data, simply double-click on it. This will open Excel again, allowing you to modify the data. When you save and close Excel, the changes will be automatically reflected in your PowerPoint presentation.
By including charts and graphs in your PowerPoint presentation, you can visually communicate complex data and make it easier for your audience to understand and interpret. Use these tools to enhance the impact of your message and create engaging presentations that leave a lasting impression.
Incorporating charts and graphs into your PowerPoint slides is a powerful way to present data in a visually appealing and informative manner. By following these simple steps, you can confidently embed these visual elements into your presentations and captivate your audience.
Inserting Live Web Content
Adding live web content to your PowerPoint presentation can make it more interactive and engaging. With just a few simple steps, you can embed live web content directly into your slides. Here’s how:
1. Open PowerPoint and navigate to the slide where you want to insert the live web content.
2. Click on the “Insert” tab on the top menu bar, then select the “Web Page” option. This will open a dialog box where you can enter the URL of the webpage you want to embed.
3. Enter the URL of the webpage you want to embed in the provided field. Make sure to include the https:// or http:// prefix to ensure the webpage loads correctly.
4. Click the “Insert” button. PowerPoint will now load the webpage and embed it into your slide. You can resize and reposition the embedded content as needed.
5. To interact with the live web content, simply run your presentation and click on the embedded webpage. This will open the webpage within PowerPoint, allowing you to scroll, click on links, or interact with any embedded elements.
6. To exit the embedded webpage, press the Esc key on your keyboard or click outside the embedded content.
Embedding live web content can be a great way to showcase real-time data, display live social media feeds, or provide up-to-date information to your audience. It adds a dynamic element to your presentation and keeps your audience engaged.
Remember to test the embedded content before your presentation to ensure that it loads correctly and functions as expected. Also, keep in mind that if you are presenting offline or in a location with limited internet access, the embedded content may not load or display properly.
With the ability to insert live web content into your PowerPoint slides, you can take your presentations to the next level and deliver a more interactive experience for your audience.
Conclusion
Embedding data in PowerPoint presentations is a powerful way to enhance the visual appeal and effectiveness of your slides. By integrating charts, tables, and other data-driven visuals, you can provide your audience with a deeper understanding of the information you are presenting.
Throughout this article, we have explored various methods to embed data in PowerPoint, including using Excel spreadsheets, inserting charts and graphs, and incorporating live data from external sources. Each method offers its own unique advantages and allows you to customize your data visualization to suit your specific needs.
Remember, the key to successful data embedding is to keep it relevant, visually appealing, and easy to understand. Be mindful of the design principles, choose the appropriate data representation, and ensure that your visuals complement the content of your slides.
So, go ahead and unleash your creativity to engage, inform, and captivate your audience with impactful data presentations in PowerPoint!
FAQs
Q: Can I embed data in PowerPoint?
Yes, you can embed data in PowerPoint presentations. This feature allows you to include charts, tables, and other types of data directly within your slides, making your presentations more informative and visually appealing.
Q: How do I embed data in PowerPoint?
To embed data in PowerPoint, you can use various methods depending on the type of data you want to include. For charts, you can create them using PowerPoint’s built-in charting tools or import them from other programs like Excel. For tables and other data, you can copy and paste them directly onto your slides or use the “Insert” tab to add them from external sources.
Q: Why should I embed data in PowerPoint?
Embedding data in PowerPoint offers several benefits. Firstly, it allows you to present complex information in a visually appealing format, making it easier for your audience to understand. Secondly, it enables you to keep your data up-to-date by linking it to external sources, ensuring that any changes in the data are reflected in your presentation. Lastly, it saves you time by eliminating the need to switch between different applications while preparing your slides.
Q: Can I edit embedded data in PowerPoint?
Yes, you can easily edit embedded data in PowerPoint. Once you have embedded the data in your slides, you can modify it by double-clicking on the embedded object. This will open the corresponding application, such as Excel for embedded spreadsheets, where you can make changes. Once you save your changes in the source application, they will automatically update in your PowerPoint presentation.
Q: Can I update embedded data in PowerPoint?
Absolutely! Embedded data in PowerPoint can be updated whenever needed. If your embedded data is linked to an external source, such as an Excel file, any changes made to the source data will be reflected in your presentation. You can also manually update embedded data by right-clicking on the embedded object and selecting the “Update Link” option. This ensures that your data is always accurate and up-to-date in your PowerPoint slides.