
Is your Android phone behaving strangely? Constant crashes, slow performance, or unresponsive apps are common issues that Android users might encounter. However, the good news is that you can easily debug your Android phone to identify and resolve these problems. Debugging refers to the process of finding and fixing technical issues or bugs that may be affecting the performance of your device.
In this article, we will guide you through the steps on how to debug your Android phone effectively. Whether you are experiencing app crashes, poor battery life, or strange behavior on your device, we have got you covered. By following these debugging techniques, you will be able to diagnose and fix common issues, ensuring your Android phone performs at its best.
Inside This Article
- Understanding the Basics of Android Debugging
- Using Developer Options to Enable USB Debugging
- Debugging Android Apps with Android Studio
- Troubleshooting Common Android Debugging Issues
- Conclusion
- FAQs
Understanding the Basics of Android Debugging
When it comes to troubleshooting issues on your Android phone, understanding the basics of Android debugging can be immensely helpful. Debugging allows you to identify and fix software glitches, system errors, and other issues that may be affecting the performance of your device. It involves accessing the device’s developer options and using various tools and techniques to diagnose and resolve problems.
Android debugging is particularly useful when you encounter issues like slow performance, app crashes, unresponsive interface, or any other unexpected behavior on your phone. By going through the debugging process, you can gain insights into the underlying causes of these problems and take the necessary steps to resolve them.
Here are some key aspects to understand about Android debugging:
- Developer Options: To enable debugging on your Android phone, you need to activate the Developer Options. This hidden menu provides access to advanced settings and features primarily designed for developers, but it can be utilized by anyone for debugging purposes. To activate Developer Options, go to your phone’s Settings, scroll down to “About phone,” and tap on it. Look for the “Build number” and tap on it seven times to unlock the Developer Options.
- USB Debugging: USB debugging is a crucial component of Android debugging. It allows your phone to communicate with a computer and transfer data for debugging purposes. To enable USB debugging, connect your Android phone to a computer via USB cable and go to the Developer Options. Toggle on the “USB debugging” option to enable it.
- ADB (Android Debug Bridge): ADB is a command-line tool that comes with the Android SDK (Software Development Kit). It allows you to communicate with your Android device through a computer and execute commands for debugging. ADB provides a range of functionalities, such as installing apps, copying files, accessing system logs, and more.
- Clearing App Cache and Data: One common troubleshooting step in Android debugging is clearing the cache and data of troublesome apps. This can often resolve issues related to app performance and stability. To clear app cache and data, go to your phone’s Settings, select “Apps” or “Applications,” then choose the app you want to clear data for. Tap on “Storage” and select “Clear cache” and “Clear data.”
- Rebooting Your Android Phone: Sometimes, a simple reboot can fix many Android issues. Restarting your phone can help clear temporary system glitches and restore normal functionality. Press and hold the power button on your phone, then select “Restart” or “Reboot” from the options menu that appears.
By understanding these basics of Android debugging and following the steps outlined above, you can effectively diagnose and resolve common issues on your Android phone. Remember to exercise caution while making changes in the Developer Options and using ADB, as improper use can lead to unintended consequences. With the right knowledge and tools, you can ensure optimal performance and functionality of your Android device.
Using Developer Options to Enable USB Debugging
USB debugging is an essential tool for Android developers and advanced users who want to debug and interact with their Android devices from a computer. To enable USB debugging, you need to access the Developer Options on your Android phone. Here’s how you can do it:
1. Open the Settings app on your Android phone. You can usually find it in the app drawer or by swiping down from the top of the screen and tapping the gear icon.
2. Scroll down and tap on “About phone” or “About device” option. This option may vary depending on your Android phone model and the version of the operating system.
3. Look for the “Build number” or “Software information” section. Tap on it repeatedly, about seven times, until you see a message saying “You are now a developer!” or “Developer mode has been enabled.”
4. Now, go back to the main Settings screen, and you will find the “Developer options” listed. Tap on it to access the developer settings.
5. In the Developer Options, scroll down and find the “USB debugging” option. It may be located under the “Debugging” or “Developer tools” section.
6. Toggle the switch next to “USB debugging” to enable it. You might see a warning message about the potential security risks. Just confirm and proceed.
7. Connect your Android phone to your computer using a USB cable. Make sure to use a data transfer cable, not just a charging cable.
8. On your computer, open the Android Debug Bridge (ADB) tool. ADB comes with the Android SDK package, which you can download from the Android developer website.
9. Once connected, you will receive a prompt on your Android phone asking for permission to allow USB debugging. Tap on “Allow” or “OK” to grant permission.
10. Congratulations! USB debugging is now enabled on your Android phone. You can now use various debugging and development tools, such as ADB commands, Android Studio, or third-party debugging apps, to interact with your device.
Remember to disable USB debugging when not in use to minimize potential security risks. Simply go back to the Developer Options and toggle off the “USB debugging” switch.
Now you are all set to debug your Android phone using USB debugging. This powerful feature allows you to troubleshoot issues, test new features and applications, and even customize your Android device to your heart’s content.
Debugging Android Apps with Android Studio
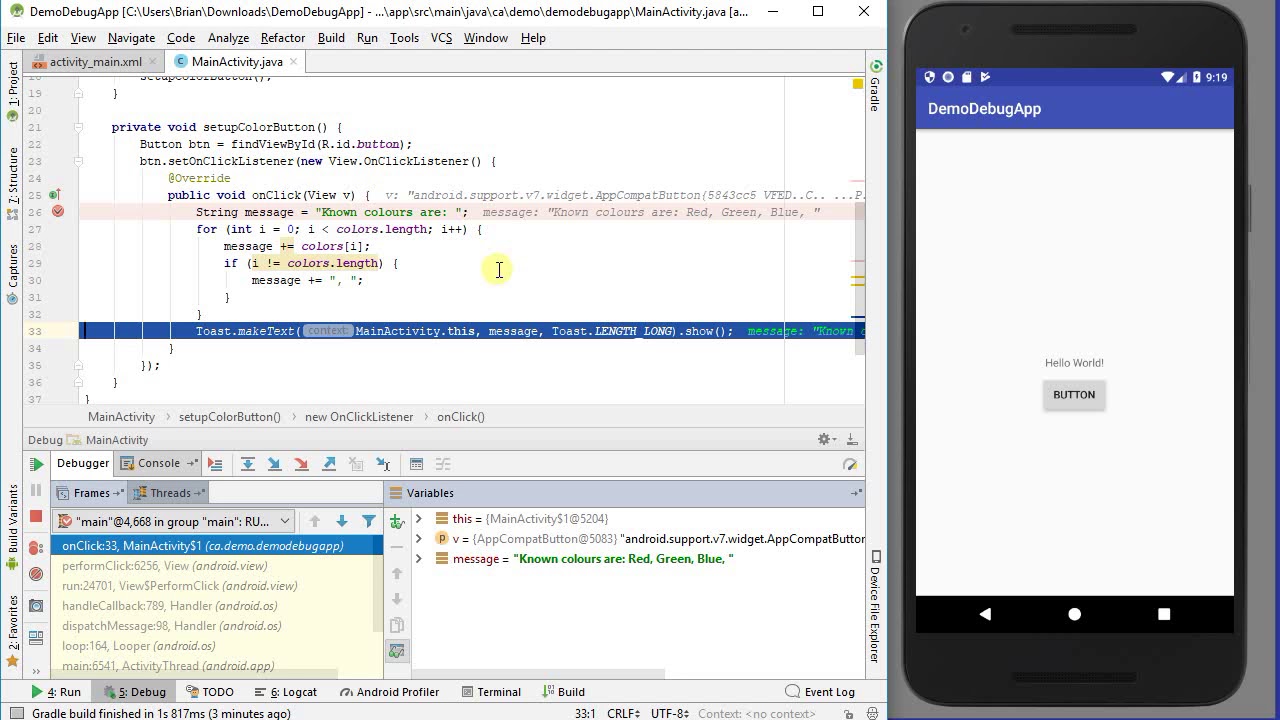
Debugging is an essential process in Android app development that allows developers to identify and fix issues within their applications. Android Studio, the official integrated development environment (IDE) for Android, provides powerful debugging tools to help developers effectively debug their apps. In this article, we will explore how to debug Android apps with Android Studio.
Debugging with Android Studio starts with setting breakpoints in your code. A breakpoint is a designated point in your code where the execution will pause, allowing you to inspect the variables and step through the code line by line. To set a breakpoint, simply click on the left-hand margin of the line where you want to pause the execution.
Once the breakpoint is set, you can launch your app in debug mode by clicking the “Debug” button in the toolbar or selecting “Debug” from the “Run” menu. Android Studio will build your app, install it on the device or emulator, and then start the debugging session.
While debugging, you can use various tools provided by Android Studio to analyze and debug your app. The most common tools include the debugger, logcat, and the Android Device Monitor.
The debugger allows you to examine the state of your app at runtime. You can view and modify variable values, step through your code line by line, and evaluate expressions. Android Studio provides a comprehensive debugger that makes it easy to track down and fix issues in your app.
The logcat is a powerful logging utility in Android Studio that displays the system and application logs in real-time. It allows you to filter and search for specific log messages, making it easier to track down issues and debug your app. You can also use log statements within your code to print custom log messages to the logcat.
The Android Device Monitor is a tool that provides additional debugging features for your Android device or emulator. It allows you to monitor the device’s performance, capture screenshots, record screen activity, and even simulate location data. The Android Device Monitor can be accessed from the “Android” menu in Android Studio.
In addition to these tools, Android Studio also provides a variety of debugging features and shortcuts to improve your debugging workflow. You can inspect and edit the layout of your app in real-time using the Layout Inspector, use breakpoints and watches to track specific variables, and even simulate different device configurations using the Virtual Device Manager.
Debugging an Android app with Android Studio may seem overwhelming at first, but with practice and familiarity, it becomes an essential skill for any Android developer. By effectively debugging your app, you can ensure its stability, performance, and user experience.
Troubleshooting Common Android Debugging Issues
Debugging Android devices can sometimes be a challenging task, especially when you encounter common issues that can hinder the debugging process. In this section, we will discuss some of the common Android debugging issues and provide troubleshooting tips to help you overcome them.
1. Device Not Recognized: One of the most common issues that users face is when their Android device is not recognized by their computer while debugging. This can be due to several reasons, such as driver issues or faulty USB cables. To troubleshoot this problem, try using a different USB cable or port, updating the device drivers, or restarting both your computer and Android device.
2. USB Debugging Not Enabled: Another frequent issue is when USB debugging is not enabled on the Android device. This feature allows your device to communicate with the computer for debugging purposes. To enable USB debugging, go to the “Developer Options” in your device’s settings and toggle on the USB debugging option. If you can’t find the Developer Options, go to “About Phone” and tap on the “Build Number” several times until it says you are now a developer.
3. ADB Connection Failure: The Android Debug Bridge (ADB) is a versatile command-line tool used for debugging Android devices. However, sometimes you may encounter connection failures with ADB. To troubleshoot this issue, try disconnecting and reconnecting your device, restarting both your computer and device, or restarting the ADB server by running the command “adb kill-server” followed by “adb start-server” in the command prompt or terminal.
4. App Crashes During Debugging: If your app crashes during the debugging process, it can make it difficult to identify the underlying issue. To troubleshoot app crashes, ensure that your code is free of any syntax errors or logical bugs. Additionally, check any error logs or stack traces that are generated when the app crashes, as they can provide valuable insights into the problem.
5. Slow Debugging Performance: Sometimes, you may experience slow or laggy performance while debugging your Android app. This can be due to resource-intensive debugging settings or running your app on an emulator with limited resources. To improve debugging performance, consider using a physical device instead of an emulator and disable unnecessary debugging settings like animation scales or window transitions.
6. Insufficient Debugging Information: At times, you may find that the default debugging information provided by Android Studio or other IDEs is not sufficient to identify and resolve issues. In such cases, consider implementing additional logging statements in your code to provide more detailed information about the app’s behavior during the debugging process.
7. Network-related Debugging Issues: If your app relies on network connections for certain functionalities, you may encounter debugging issues related to network connectivity or timeouts. To troubleshoot these issues, check your internet connection, ensure your device has proper network access, and review your network-related code for any errors or timeouts that may be causing the problem.
By troubleshooting these common Android debugging issues, you can enhance your debugging process and overcome challenges that may arise. Remember to stay patient and methodical when debugging, as it may take time to identify and resolve the root cause of the problem.
Debugging your Android phone can be a crucial skill for any Android user. Whether you’re experiencing app crashes, performance issues, or any other software-related problem, knowing how to effectively debug your device can save you time and frustration.
In this article, we’ve discussed various methods to debug your Android phone, ranging from checking for software updates and optimizing system settings to using built-in tools like Developer Options and USB debugging. By following the steps outlined in this guide, you can identify and resolve common issues, improve the overall performance of your device, and ensure a smoother user experience.
Remember, debugging your Android phone requires a systematic approach and patience. It’s always a good idea to backup your data before attempting any troubleshooting steps. If you’re unsure about any specific steps, it’s recommended to seek further assistance from reputable sources or contact the manufacturer’s support team.
With the knowledge and skills gained from this article, you’ll be better equipped to tackle any software-related issues that may arise on your Android phone. Happy debugging!
FAQs
1. Why is debugging important for Android phones?
Debugging is crucial for Android phones as it allows developers and users to identify and fix issues that may arise in the software or hardware. It helps in troubleshooting problems, testing and optimizing app performance, and improving overall functionality.
2. How can I enable USB debugging on my Android phone?
To enable USB debugging on your Android phone, follow these steps:
- Go to your phone’s Settings.
- Scroll down and tap on “About phone” or “About device”.
- Find the “Build number” or “Software information” option and tap on it multiple times until you see a message saying “You are now a developer”.
- Go back to the main Settings menu and find the newly appeared “Developer options” or “Developer settings”.
- Open “Developer options” and scroll down to find “USB debugging”. Toggle it on.
3. What is ADB and how does it help in debugging Android phones?
ADB stands for Android Debug Bridge. It is a versatile command-line tool that allows communication with an Android device, enabling debugging and executing various commands. ADB helps developers troubleshoot issues, install and uninstall apps, copy files, take screenshots, and much more.
4. What are some common debugging techniques for Android phones?
Some common debugging techniques for Android phones include:
- Inspecting logcat output to identify errors or warnings.
- Running the app in debug mode using an IDE like Android Studio.
- Setting breakpoints in the code to halt execution and inspect variables.
- Using the Android Device Monitor or the new Android Profiler for performance analysis.
- Using tools like ADB to capture bug reports, take screenshots, and more.
5. How can I resolve common debugging issues on my Android phone?
If you encounter common debugging issues on your Android phone, try the following solutions:
- Ensure that USB debugging is properly enabled on your phone.
- Make sure you have the correct USB drivers installed on your computer.
- Use a different USB cable or port to connect your phone.
- Restart your phone and computer.
- Update the Android SDK tools and platform tools.