
Are you struggling with removing a pivot table without losing your data? Well, you’re in luck! In this article, we will walk you through the step-by-step process of removing a pivot table while preserving your valuable data. Pivot tables are powerful tools that allow you to analyze and summarize large sets of data. However, there may be instances where you no longer need a pivot table, or you want to convert it back to a regular data table. Whatever the reason, we’ve got you covered. By following our easy-to-understand instructions, you’ll be able to remove a pivot table efficiently and effectively, ensuring that your data remains intact. So, let’s dive in and discover the best methods to remove a pivot table while keeping your valuable data safe and accessible.
Inside This Article
- Section 1: Understanding Pivot Tables
- Section 2: Removing a Pivot Table
- Section 3: Preserving Data without a Pivot Table
- Section 4: Alternative Data Analysis Techniques
- Conclusion
- FAQs
Section 1: Understanding Pivot Tables
Pivot tables are a powerful tool in data analysis and reporting. They allow you to quickly summarize and analyze large amounts of data from various angles. In simple terms, a pivot table is a data summarization tool that enables you to extract useful insights from raw data.
With pivot tables, you can easily break down complex data into meaningful categories and subcategories, allowing you to identify trends, patterns, and relationships. This makes them incredibly useful for business intelligence, financial analysis, and decision-making processes.
To create a pivot table, you start with a dataset that contains rows and columns of information. The pivot table then rearranges and summarizes this data based on your specified criteria. You can choose which columns to group the data by and which values to aggregate, such as sum, count, average, or maximum/minimum values.
By dragging and dropping fields into different sections of the pivot table, you can quickly change its layout and analyze the data from various dimensions. This flexibility allows you to gain insights that may have been hidden in the raw data.
Another essential feature of pivot tables is their ability to apply filters. These filters help you narrow down the data to focus on specific subsets or conditions. For example, you can filter the data by a specific date range or product category to examine trends or performance in more detail.
Overall, pivot tables provide a dynamic and interactive way to examine and understand your data better. They empower you to transform large datasets into concise and meaningful information, helping you make informed decisions and drive strategic actions.
Section 2: Removing a Pivot Table
Removing a pivot table is a simple process that involves a few steps. Here’s how you can do it:
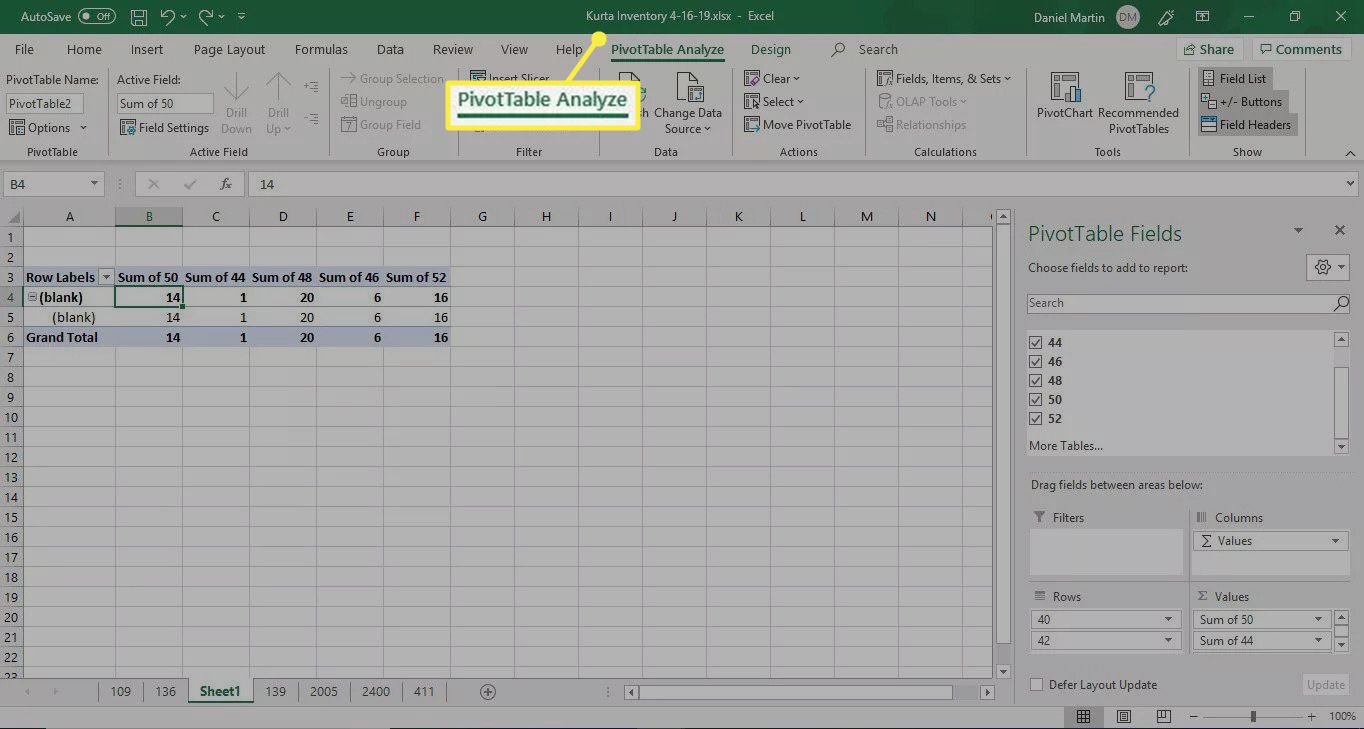
1. Select the pivot table: Start by clicking on any cell within the pivot table. This will activate the “PivotTable Tools” menu on the Excel ribbon.
2. Go to the “Analyze” tab: Once the “PivotTable Tools” menu is activated, navigate to the “Analyze” tab, which is located next to the “Design” tab.
3. Click on “Clear”: In the “Analyze” tab, you will find a “Clear” button. Click on it to open a dropdown menu.
4. Choose “Clear All”: From the dropdown menu, select the option “Clear All” to remove the pivot table and all associated formatting and calculations.
5. Confirm the removal: A confirmation prompt will appear, asking if you want to remove the pivot table. Click on “Yes” to proceed with the removal.
6. Pivot table is removed: After confirming the removal, the pivot table will be deleted, and the cell range that previously contained the pivot table will revert back to normal data.
It’s important to note that removing a pivot table will permanently delete it, along with any calculated fields, calculated items, and other configurations associated with it. So, make sure to take a backup or copy the data before removing the pivot table if you may need it in the future.
Section 3: Preserving Data without a Pivot Table
In some cases, you may find it necessary to remove a pivot table from your data analysis workflow. However, that doesn’t mean you have to lose the valuable insights and analysis that a pivot table provides. There are alternative methods that can help you preserve and analyze your data effectively. Let’s explore some of these techniques:
1. Using Filters: One way to preserve data without a pivot table is by using filters. Most spreadsheet software allows you to apply filters to your data set, which allows you to isolate specific criteria and view the corresponding results. By applying filters strategically, you can obtain similar insights as you would with a pivot table.
2. Creating Subtotals: Another option is to use the subtotal feature available in spreadsheet software. With subtotals, you can group and summarize your data based on specific columns or criteria. This allows you to get a high-level overview of your data without the need for a pivot table. Subtotals can provide insights into patterns and trends within your data.
3. Utilizing Formulas: Formulas are a powerful tool for data analysis. By using functions like SUM, AVERAGE, MAX, and MIN, you can perform calculations directly on your data set. This allows you to extract meaningful information and analyze trends without the need for a pivot table. Formulas can be used to calculate totals, averages, percentages, and more.
4. Constructing Custom Reports: If you require more specialized analysis, you can create custom reports by using a combination of functions, formulas, and conditional formatting. With custom reports, you have the flexibility to tailor your analysis to specific requirements, allowing for more detailed insights and visualizations.
5. Exploring Data Visualization Tools: Consider using data visualization tools, such as charts and graphs, to present and analyze your data in a visual format. These tools can help you identify patterns, trends, and outliers more easily, even without a pivot table. Data visualization enhances the understanding of complex data sets and enables intuitive analysis.
6. Pivot Table Alternatives: Lastly, there are software applications and add-ons that offer alternatives to pivot tables. These tools provide similar functionalities and capabilities but may have different interfaces or approaches. Exploring these alternatives can help you find a suitable solution that aligns with your analytical needs.
By using these techniques, you can effectively preserve and analyze your data even without a pivot table. Each method offers its own unique benefits and should be chosen based on the specific requirements of your analysis. Don’t let the absence of a pivot table hinder your ability to gain valuable insights from your data.
Section 4: Alternative Data Analysis Techniques
While pivot tables are an incredibly useful tool for data analysis, there are alternative techniques that you can employ to achieve similar results. These techniques can provide insights and valuable information to help you make informed decisions. Let’s explore some of the alternatives.
1. Data Visualization Tools: Visualizing data through charts, graphs, and infographics can convey complex insights in a more digestible format. Tools like Tableau, Power BI, and Google Data Studio enable you to create interactive visualizations that uncover patterns and trends within your data.
2. Statistical Analysis: Statistical analysis techniques like regression analysis, correlation analysis, and hypothesis testing can help you identify relationships and associations between variables. These methods provide a deeper understanding of the data and can be useful in predicting future outcomes.
3. Data Mining: Data mining involves discovering patterns, relationships, and insights from large datasets. Techniques like association analysis, clustering, and classification can uncover hidden patterns and provide valuable insights for decision-making.
4. Machine Learning: Machine learning algorithms can be trained to analyze and make predictions based on data. Techniques like supervised learning, unsupervised learning, and reinforcement learning can provide advanced analysis and predictive modeling capabilities.
5. Text Mining: Text mining involves extracting valuable information from unstructured text data. By employing techniques like sentiment analysis, topic modeling, and text classification, you can gain valuable insights from sources like customer feedback, social media data, and survey responses.
6. Exploratory Data Analysis (EDA): EDA involves visually exploring data to uncover patterns, outliers, and relationships. By utilizing techniques like histograms, scatter plots, and box plots, you can gain a better understanding of the data distribution and identify any anomalies.
It’s important to note that these alternative data analysis techniques do not replace pivot tables but rather complement them. Depending on the nature of your data and the insights you’re seeking, you can choose the most appropriate technique or even combine multiple techniques to gain a comprehensive understanding of your data.
By diversifying your data analysis approach, you can uncover deeper insights and make more informed decisions. Each technique brings its own unique advantages and can add value to your overall data analysis process.
Conclusion
Removing a pivot table while preserving the underlying data is a crucial skill for anyone working with data analysis and reporting. By following the steps outlined in this article, you can confidently remove a pivot table without losing any valuable information.
First, ensure that you understand the purpose and impact of removing the pivot table. Backup your data or create a copy to avoid any accidental data loss. Next, apply the necessary steps according to the tool you are using, such as Microsoft Excel or Google Sheets. Utilize the features available, like the “Clear” or “Delete” options, to remove the pivot table while leaving the data intact.
Remember to double-check your actions before proceeding to prevent any potential mistakes. By mastering this skill, you can efficiently manage and manipulate your data, ensuring accurate analysis and reporting for better decision-making.
So, next time you need to remove a pivot table, confidently follow the steps mentioned above and keep your data safe!
FAQs
1. Can I remove a pivot table and still keep the data?
Yes, you can remove a pivot table and still keep the underlying data. The pivot table is just a visual representation of the data, allowing you to analyze and summarize it easily. When you remove the pivot table, the original data will remain intact.
2. How do I remove a pivot table in Excel?
To remove a pivot table in Excel, follow these steps:
- Select any cell within the pivot table.
- Go to the “PivotTable Analyze” or “Options” tab, depending on your Excel version.
- Click on the “Options” or “Actions” button, and select “Delete” or “Remove” from the dropdown menu.
- A confirmation dialog box will appear. Choose whether you want to delete the entire pivot table or just the pivot table report.
- Click “OK” to remove the pivot table.
3. Will removing a pivot table affect the source data?
No, removing a pivot table does not affect the source data. The pivot table is simply a separate object that refers to the source data. Deleting or removing the pivot table will not modify or delete any of the original data.
4. Can I restore a removed pivot table?
Once you remove a pivot table, you cannot restore it exactly as it was. However, if you have the original data and the steps you used to create the pivot table, you can recreate it. Alternatively, you can use the Undo feature in Excel to revert the removal if you haven’t performed any other actions after removing the pivot table.
5. What if I accidentally remove a pivot table in Excel?
If you accidentally remove a pivot table in Excel, you can use the Undo feature to bring it back. Simply press Ctrl + Z or click on the “Undo” button in the toolbar to revert the removal. However, please note that this will only work if you haven’t performed any other actions after removing the pivot table.